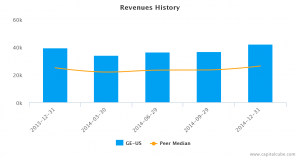
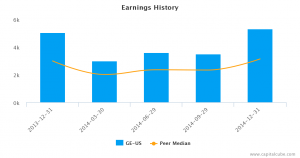
General Electric Company (NYSE:GE) reported revenue of $42.0 B, up 4 percent from Q4 2013, and net earnings of $5.29 B, up from $3.21 B from the same quarter. Operating Earnings per Share (EPS) were $0.56, up 6 percent year-over-year, led by EPS from the Industrial segment, which grew by 23 percent.
GE’s performance in the US continued to strengthen, as did Asia. Growth in the Aviation and Healthcare units offset weakness in the Oil & Gas segment, which was 17 percent of GE’s 2014 Industrial segment revenue. GE managed to hold sales in this division steady amid the challenge of falling oil prices. However, the company is preparing for intensifying trouble in the Oil & Gas unit in the coming year.
The Power and Water Group, the largest Industrial segment at 30 percent of revenue, reported an increase in revenue of 22 percent and increase in earnings of 13 percent year-over-year. GE forecasts that, helped by the purchase and integration of French company Alstom, profits in this segment will rise by double digits in 2015. This could help offset weakness in the Oil & Gas division.
GE’s priorities for 205 include a spinoff of Synchrony Financial, which will help the company continue its effort to reduce reliance on earnings from its large finance arm, GE Capital, and return to its focus to its heavy-industry core.
This earnings release follows the earnings announcements from the following peers of General Electric Company – Honeywell International Inc. (HON-US).
Highlights
- Summary numbers: Revenues of $42.0 B; Net Earnings of $5.29 B; and Earnings per Share (EPS) of $0.51.
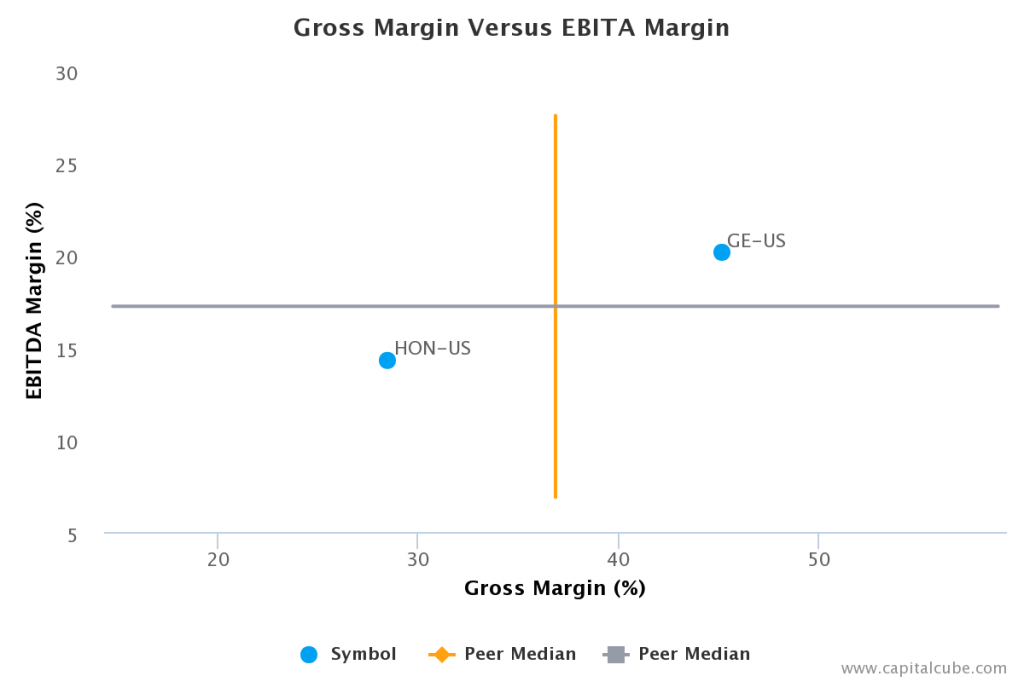
- Gross margins narrowed from 51.0 percent to 45.2 percent compared to the same quarter last year; operating (EBITDA margins now 20.1 percent from 22.3 percent.
- Earnings growth from operating margin improvements as well as one-time items.
- Earnings per Share (EPS) growth exceeded earnings growth.
The table below shows the preliminary results and recent trends for key metrics such as revenues and net income growth:
Market Share Versus Profits
Companies sometimes focus on market share at the expense of profits or earnings growth.
Revenues Trend
Earnings Trend
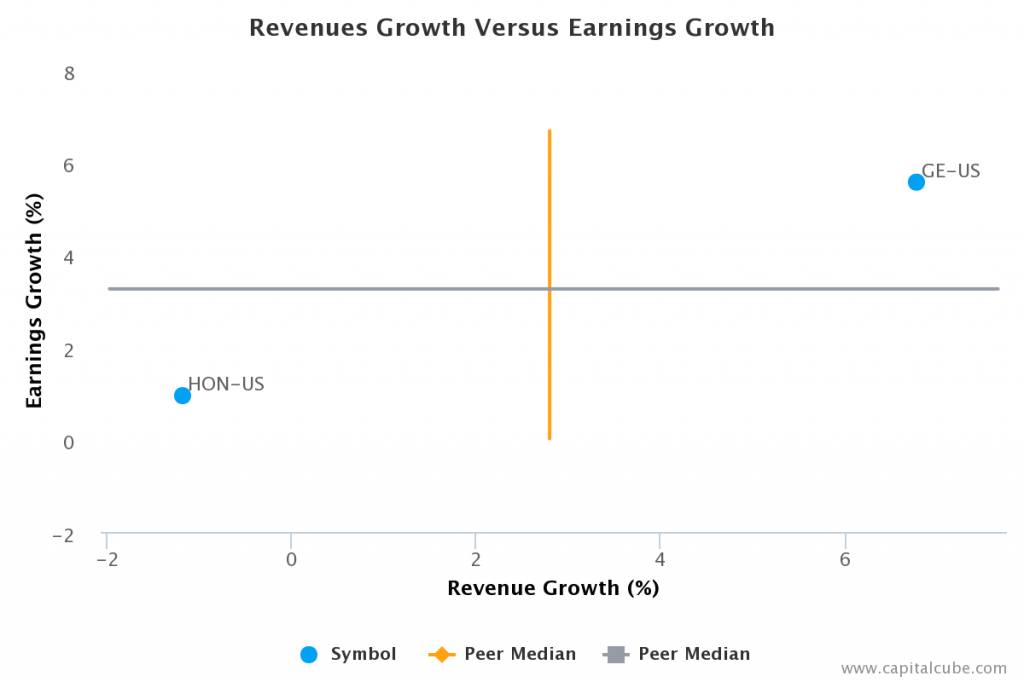
Compared to the same quarter last year, General Electric’s change in revenue of 6.8 percent surpassed its change in earnings, which was 5.6 percent. This suggests perhaps that GE’s focus is on market share at the expense of bottom-line earnings. However, the change in revenue is better than its peer average, pointing to perhaps some longer-lasting success at wrestling market share from its competitors. This competitive success helps Capital Cube look past its weaker earnings performance this period. Also, for comparison purposes, revenues changed by 15.0 percent and earnings by 52.1 percent vs. the quarter ended September 30, 2014.
Revenues vs Earnings
Earnings Growth Analysis
The company's earnings rose year-on-year. But this growth has not come as a result of improvement in gross margins or any cost control activities in its operations. Gross margins narrowed from 51.0 percent to 45.2 percent for Q4 2013, while operating margins (EBITDA margins) went from 20.1 percent to 22.3 percent over the same time frame.
Gross Margin vs EBITDA Margin
Gross Margin Trend
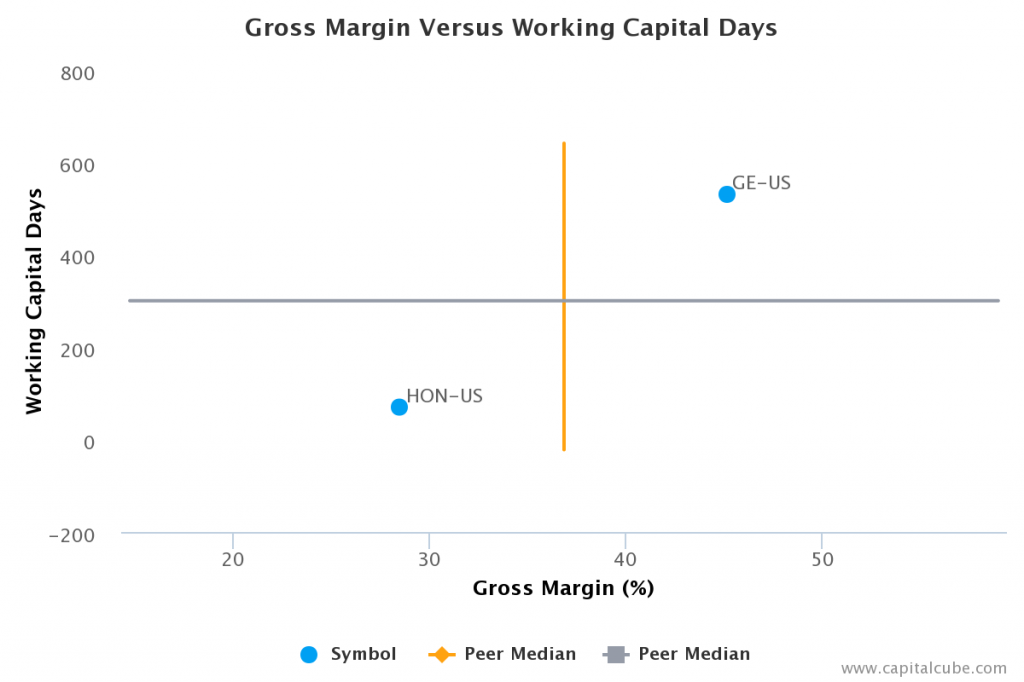
Companies sometimes sacrifice improvements in revenues and margins in order to extend friendlier terms to customers and vendors. Capital Cube probes for such activity by comparing the changes in gross margins with any changes in working capital. If the gross margins improved without a worsening of working capital, it is possible that the company's performance is a result of truly delivering in the marketplace and not simply an accounting gimmick using the balance sheet.
Gross Margin vs Working Capital Days
GE’s contraction in gross margins were offset by some improvements on the balance sheet. The management of working capital, for example, shows progress. The company's working capital days have fallen to 530.6 days from 576.5 days for the same period last year. This leads Capital Cube to conclude that the gross margin decline is not altogether bad.
Margins
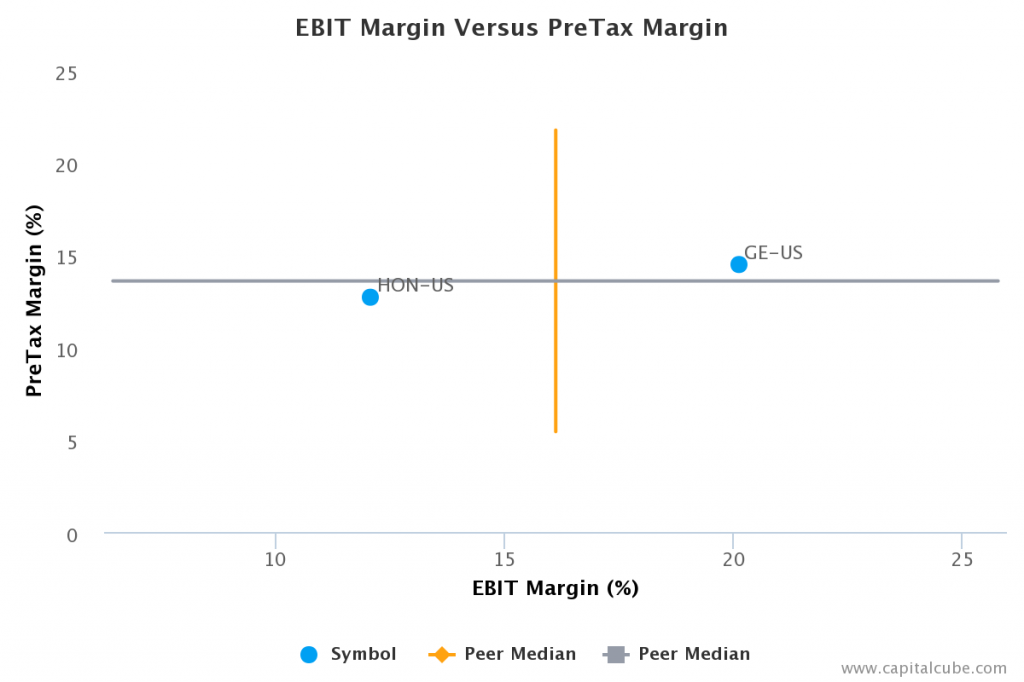
The company's earnings growth has also been influenced by the following factors: (1) Improvements in operating (EBIT) margins from 15.6 percent to 20.1 percent and (2) One-time items. The company's pretax margins are now 14.5 percent compared to 11.9 percent for the same period last year.
EBIT Margin vs Pretax Margin
EPS Growth Versus Earnings Growth
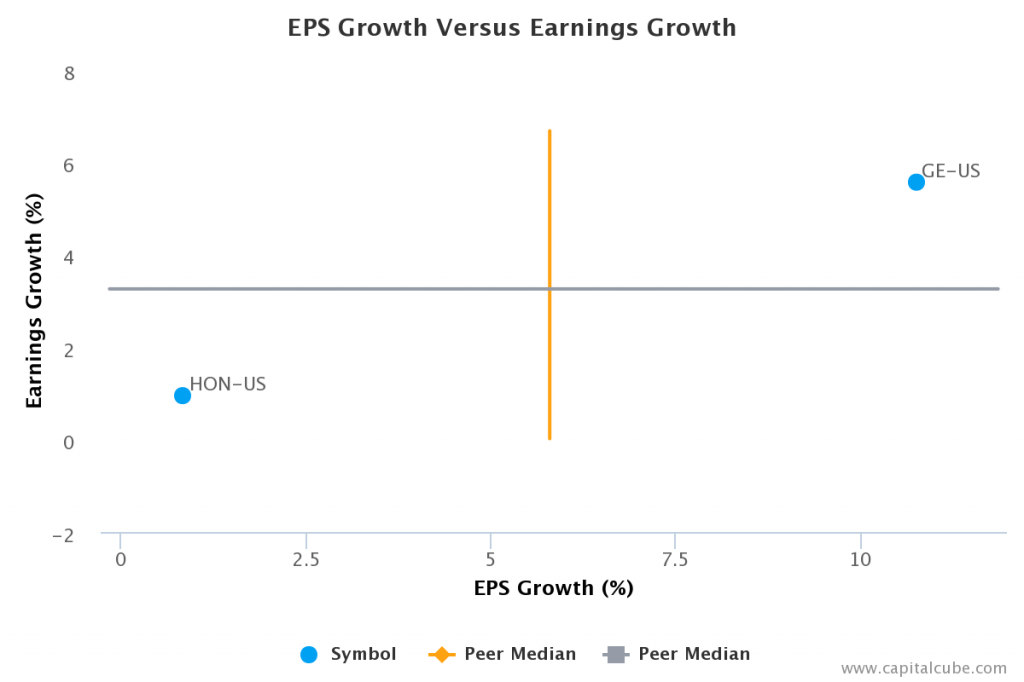
GE’s change in Earnings per Share (EPS) of 10.8 percent compared to the same quarter last year is better than its change in earnings of 5.6 percent. This suggests that the company is managing its earnings reporting. However, the 5.6 percent change in earnings is better than the peer average among the results announced to date, suggesting that the company is gaining ground in generating profits from its competitors.
EPS Growth vs Earnings Growth
Company Profile
General Electric Co. is a technology and financial services company that develops and manufactures products for the generation, transmission, distribution, control and utilization of electricity. Its products and services include aircraft engines, power generation, water processing, security technology, medical imaging, business and consumer financing, media content and industrial products. The company operates through eight segments: Power & Water, Oil & Gas, Energy Management, Aviation, Healthcare, Transportation, Home & Business Solutions and GE Capital. The Power & Water segment serves power generation, industrial, government and other customers worldwide with products and services related to energy production. The Oil & Gas segment supplies mission critical equipment for the global oil and gas industry, used in applications spanning the entire value chain from drilling and completion through production, liquefied natural gas and pipeline compression, pipeline inspection, and downstream processing in refineries and petrochemical plants.
The Energy Management segment provides integrated electrical products and systems used to distribute, protect and control energy and equipment. It manufacture electrical distribution and control products, lighting and power panels, switchgear and circuit breakers that are used to distribute and manage power in a variety of residential, commercial, consumer and industrial applications. The Aviation segment produces, sells and services jet engines, turboprop and turbo shaft engines, and related replacement parts for use in military and commercial aircraft. Its military engines are used in a wide variety of aircraft including fighters, bombers, tankers, helicopters and surveillance aircraft and as well as marine applications. The Healthcare segment provides healthcare technologies such as medical imaging and information technologies, medical diagnostics, patient monitoring systems, disease research, drug discovery and biopharmaceutical manufacturing technologies.
This segment predicts and detects disease earlier; monitoring its progress and informing physicians, and helping physicians tailor treatment for patients. The Transportation segment provides technology solutions for customers in various industries, which include railroad, transit, mining, oil and gas, power generation and marine. It also provides portfolio of service offerings designed to improve fleet efficiency and reduce operating expenses, including repair services, locomotive enhancements, modernizations, and information-based services like remote monitoring and diagnostics. The Home & Business Solutions invests in the development of differentiated products such as energy efficient solutions for both consumers and businesses. Its products include major appliances and subsets of lighting products are primarily directed to consumer applications, while other lighting products and automation solutions are directed towards commercial and industrial applications. The GE Capital segment's services include commercial loans and leases, fleet management, financial programs, home loans, credit cards, personal loans and other financial services. It provides its services for all sizes of businesses worldwide. The company was founded by Thomas A. Edison in 1878 and is headquartered in Fairfield, CT.
CapitalCube does not own any shares in the stocks mentioned and focuses solely on providing unique fundamental research and analysis on approximately 50,000 stocks and ETFs globally. Try any of our analysis, screener or portfolio premium services free for 7 days. To get a quick preview of our services, check out our free quick summary analysis of GE.

