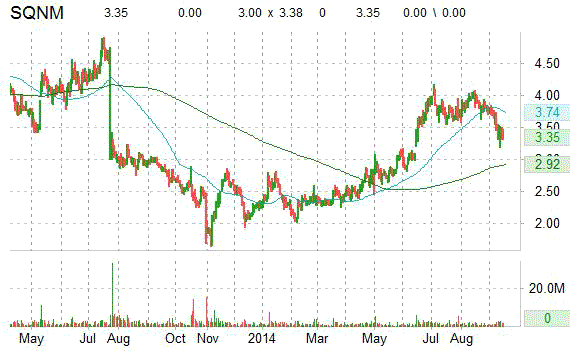
Recent short interest data for the 8/29/2014 settlement date shows a decrease in short interest for shares of Sequenom Inc. (SQNM). As of August 29, the short interest for the life sciences company totaled 18,665,484 shares, as compared to 19,847,073 shares since August 15, a decline of 5.95%. Average daily volume [AVM] for the same period fell by 387,000 to 1,418,063 shares from 1,805,954 shares. It is worth mentioning that ticker’s short interest has decreased by more than 6M shares, or 24.57%, from the 4/30/2014 settlement date.
Based on the latest AVM, the days-to-cover ratio — a metric that includes both the total shares short and the average daily volume of shares traded — is currently 13.16 days. Days-to-cover for SQNM increased to 13.16 for the August 29 settlement date, as compared to 10.98 days at the August 15 report.
Sequenom Inc. has a beta of 0.53 and a short float of 20.60%. In the past 52 weeks, shares of San Diego, California-based company have traded between a low of $1.65 and a high of $4.17 and are now at $3.35. Shares are up 16.72% year-over-year and 43.16% year-to-date.
The chart below shows where the equity has traded over the last year, with the 50-day and 200-day moving averages included.
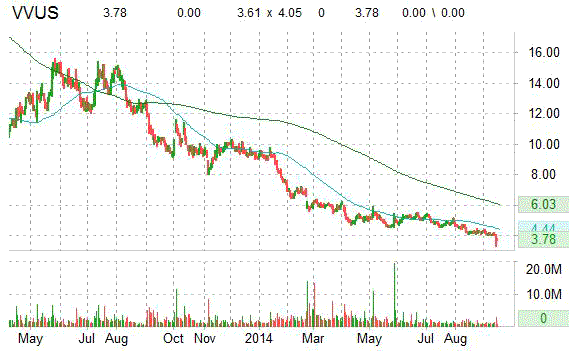
Recent short interest data for the 8/29/2014 settlement date shows a decrease in short interest for shares of VIVUS Inc. (VVUS). As of August 29, the short interest for the biopharmaceutical company totaled 33,888,398 shares, as compared to 36,093,277 shares since August 15, a decline of 6.10%. Average daily volume [AVM] for the same period fell by about 311,000 to 1,218,869 shares from 1,529,010 shares. It is worth mentioning that ticker’s short interest has decreased by more than 6.7M shares, or 16.52%, from the 6/13/2014 settlement date.
Based on the latest AVM, the days-to-cover ratio — a metric that includes both the total shares short and the average daily volume of shares traded — is currently 27.80 days. Days-to-cover for VVUS increased to 27.80 for the August 29 settlement date, as compared to 23.60 days at the August 15 report.
VIVUS Inc. has a beta of 1.66 and a short float of 38.20%. In the past 52 weeks, shares of Mountain View, California-based company have traded between a low of $3.32 and a high of $11.64 and are now at $3.78. Shares are down 62.65% year-over-year and 58.37% year-to-date.
The chart below shows where the equity has traded over the last year, with the 50-day and 200-day moving averages included.
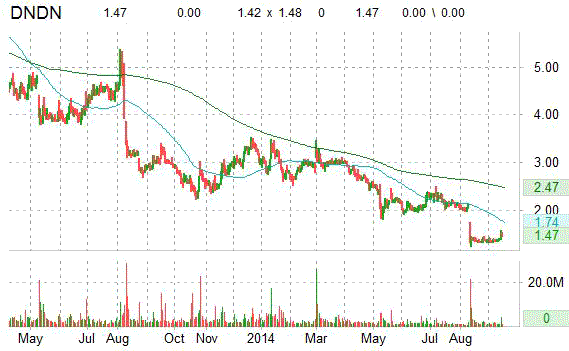
Recent short interest data for the 8/29/2014 settlement date shows a decrease in short interest for shares of Dendreon Corp. (DNDN). As of August 29, the short interest for the biotechnology company totaled 41,095,068 shares, as compared to 43,418,748 shares since August 15, a decline of 5.35%. Average daily volume [AVM] for the same period fell by 2.39M to 1,795,427 shares from 4,187,127 shares. It is worth mentioning that ticker’s short interest has fallen by more than 3.84M shares, or 8.55%, from the 2/14/2014 settlement date.
Based on the latest AVM, the days-to-cover ratio — a metric that includes both the total shares short and the average daily volume of shares traded — is currently 22.88 days. Days-to-cover for DNDN increased to 22.88 for the August 29 settlement date, as compared to 10.36 days at the August 15 report.
Dendreon Corp. has a beta of 3.89 and a short float of 26.30%. In the past 52 weeks, shares of Seattle, Washington-based company have traded between a low of $1.24 and a high of $3.52 and are now at $1.47. Shares are down 51.24% year-over-year and 50.84% year-to-date.
The chart below shows where the equity has traded over the last year, with the 50-day and 200-day moving averages included.
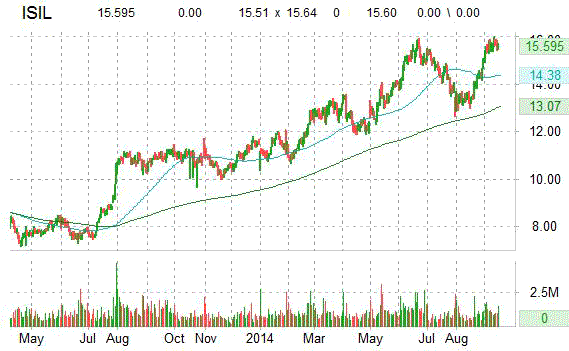
Recent short interest data for the 8/29/2014 settlement date shows a decrease in short interest for shares of Intersil Corporation (ISIL). As of August 29, the short interest for the designer of high performance analog and mixed signal semiconductors totaled 3,473,946 shares, as compared to 3,370,838 shares since August 15, a decline of 3.05%. Average daily volume [AVM] for the same period rose by about 5,000 to 1,002,142 shares from 896,875 shares. It is worth mentioning that ticker’s short interest has decreased by more than 941,000 shares, or 21.31%, from the 6/30/2014 settlement date.
Based on the latest AVM, the days-to-cover ratio — a metric that includes both the total shares short and the average daily volume of shares traded — is currently 3.46 days. Days-to-cover for ISIL decreased to 3.46 for the August 29 settlement date, as compared to 3.75 days at the August 15 report.
Intersil Corporation has a beta of 1.43 and a short float of 3.10%. In the past 52 weeks, shares of the Milpitas, California-based company have traded between a low of $9.98 and a high of $15.95 and are now at $15.60. Shares are up 42.21% year-over-year and 36% year-to-date.
The chart below shows where the equity has traded over the last year, with the 50-day and 200-day moving averages included.
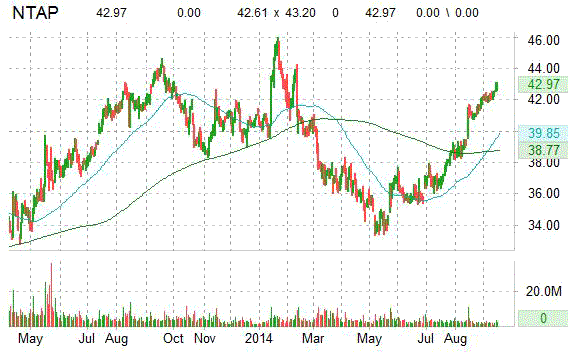
Recent short interest data for the 8/29/2014 settlement date shows a decrease in short interest for shares of NetApp, Inc. (NTAP). As of August 29, the short interest for the designer and manufacturer of networked storage solutions totaled 8,569,817 shares, as compared to 8,905,213 shares since August 15, a decline of 3.92%. Average daily volume [AVM] for the same period fell by 1.57M to 2,528,334 shares from 4,099,771 shares. It is worth mentioning that ticker’s short interest has jumped by more than 2.8M shares, or 48.74%, from the 6/30/2014 settlement date.
Based on the latest AVM, the days-to-cover ratio — a metric that includes both the total shares short and the average daily volume of shares traded — is currently 3.38 days. Days-to-cover for NTAP increased to 3.38 for the August 29 settlement date, as compared to 2.17 days at the August 15 report.
NetApp, Inc. has a beta of 1.78 and a short float of 2.20%. In the past 52 weeks, shares of Sunnyvale, California-based company have traded between a low of $33.34 and a high of $45.96 and are now at $42.97. Shares are down 1.83% year-over-year ; up 4.45% year-to-date.
The chart below shows where the equity has traded over the last year, with the 50-day and 200-day moving averages included.
Disclaimer: This page contains affiliate links. If you choose to make a purchase after clicking a link, we may receive a commission at no additional cost to you. Thank you for your support!
Leave a Reply