The past week saw New York-based carrier JetBlue Airways Corporation (NASDAQ:JBLU) and Hawaiian Airlines’ parent company, Hawaiian Holdings Inc (NASDAQ:HA), reporting better-than-expected adjusted earnings for the fourth quarter of 2014. Fourth quarter results for these companies were positively impacted by low oil prices, as was the case with several other carriers. This is because fuel costs account for a major chunk of an airline company's operating expenses.
On the non-earnings front, Alaska Air Group Inc (NYSE:ALK) kicked off 2015 on a strong note, reporting impressive traffic data for the month of January. However, airline behemoth Delta Air Lines revealed a 3.5% decline in passenger unit revenues (PRASM) in January. Moreover, during the week American Airlines Group (NASDAQ:AAL) inked a five-year deal with its pilots, which guarantees them a 23% pay hike with immediate effect and a 3% raise in each of the subsequent five years.
However, on the price front, it was not all good news for most airline stocks, as oil prices reflected a rise. Consequently, the NYSE ARCA Airline index lost 4.5% over the last 5 trading days.
(Read the last ‘Airline Stock Roundup’ here: Earnings Dominate Headlines; American Airlines and Southwest Beat Estimates).
Recap of Most Important Stories of the Last Five Trading Days
1. JetBlue performed impressively in the fourth quarter of 2014 reporting better-than-expected earnings. The company’s fourth quarter adjusted earnings of 26 cents surpassed the Zacks Consensus Estimate by 3 cents. Operating revenues increased 5.9% year over year to $1.45 billion in the reported quarter and were in line with the Zacks Consensus Estimate (read more: JetBlue Up on Q4 Earnings Beat, In-Line Revenues).
2. Hawaiian Holdings’ fourth quarter adjusted earnings of 40 cents per share were 2 cents ahead the Zacks Consensus Estimate. Quarterly revenues of $575 million also outpaced the Zacks Consensus Estimate of $571 million. Results benefited from a 9.3% decline in fuel costs to $2.84 per gallon during the quarter. Operating revenue per available seat mile in the quarter climbed 6.1% year over year. Load factor climbed 140 basis points to 82.2%.
On a reported basis, earnings declined 45% to 17 cents in the quarter. Fuel hedging losses hurt results. The stock was hurt by the weak projection for the first quarter issued by the company with operating revenue per ASM (RASM) expected to decrease in the band of 3.5% to 6.5%. Adverse foreign exchange movements and lower fuel surcharges on some of its international routes led to the disappointing outlook.
3. American Airlines Group, which came into being following the Dec 2013 merger of AMR (American Airlines' parent group) and US Airways, inked a 5-year contract with its pilots. The approval of the contract by the members of the Allied Pilots Association (APA) makes the pilots eligible for a 23% pay raise with immediate effect followed by a 3% pay hike in each of the 5 following years. The signing of the contract, which won the backing of 65.7% pilots of APA, is a major positive as the deal won’t have to go through the time-consuming arbitration process.
.4. Delta Air Lines stated that its PRASM (a measure of unit revenue) declined 3.5% in Jan 2015 due to winter storms and a soft international business attributable to weakness in the Japanese yen and the euro. The weakness impacted the stock negatively. Demand was strong on the domestic front. System capacity climbed 6% in January. Delta’s monthly completion factor was 98.9% while on-time arrival rate was 86.1%.
5. Alaska Air Group revealed impressive traffic data for the month of January. Air traffic, in revenue passenger miles, went up 7.9% year over year on a consolidated basis. Capacity or available seat miles increased 10.4% from a year ago, while load factor (percentage of seats filled with passengers) declined 190 basis points year over year to 80.5%.
Performance
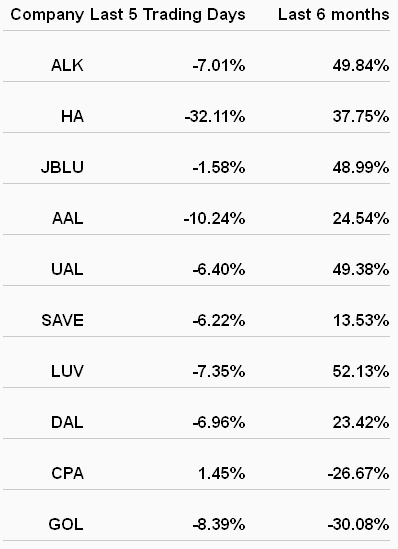
The following table shows the price movement of the major airline players over the last 5 trading days and during the last 6 months.

As the above chart suggests, the last five trading days have weighed on stocks in the airline space primarily due to rising oil prices. Hawaiian Holdings’ was the biggest loser with its shares shedding 32.11% during the period, courtesy the weak RASM projection for the first quarter. Southwest Airlines Company (NYSE:LUV) witnessed the highest upside (52.13%) over the last six months.
What’s Next in the Airline Biz?
With the fourth quarter earnings almost over as far as the airlines industry is concerned, focus shifts to non-earnings news. We expect January traffic updates from companies like Southwest, American Airlines and United Continental Holdings Inc (NYSE:UAL) in the next five trading days.
