


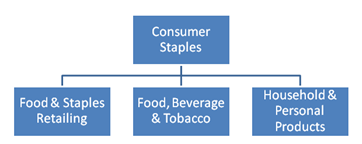
Consumer Staples are considered a more conservative and defensive sector. After all, no matter the economic conditions people still need “stuff” from soap to toothpaste. The earnings growth rate for these companies is more limited due to intensive competition as big box retailers have forced prices lower squeezing margins. Big box retailers Walmart and others have also been able to dictate pricing terms to suppliers putting a squeeze on them as well. This has kept consumer prices lower which is a good thing even though it in so doing it has forced smaller operations out of business...
A defensive sector like Consumer Staples will outperform when equity markets are more bearish and underperform when bullish. They will trend in the same manner overall but still with less beta or volatility since as indicated, even the worst of times, people will need stuff.
There is a wide array of ETFs devoted to the sector providing U.S. and global exposure. Most are linked to established indexes tied to well-known index providers including Russell, S&P, Barclays, MSCI, Dow Jones, Wisdom Tree, PowerShares, EG Shares and so forth. Also included are some so-called “enhanced” indexes that attempt to achieve better performance through more active management of the index
New issues are coming to market consistently (especially globally) and sometimes these issues will need to become more seasoned before they may be included in our listings.
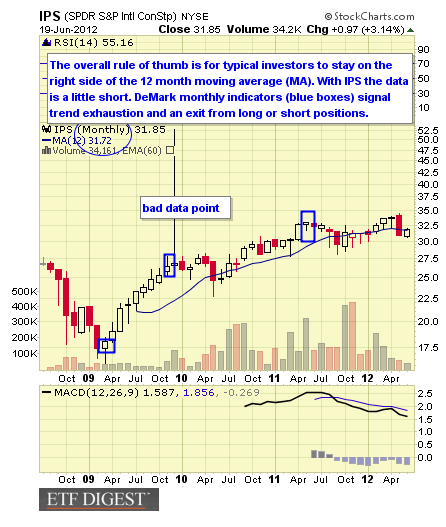
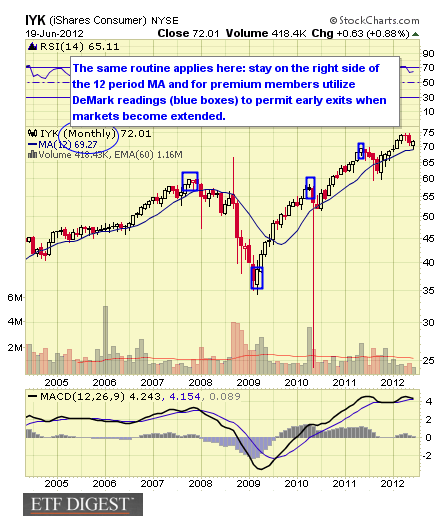
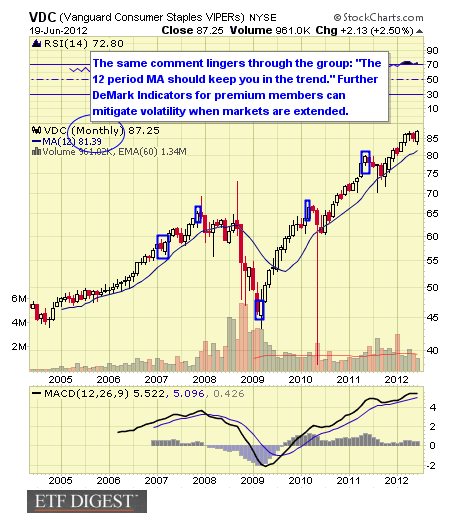
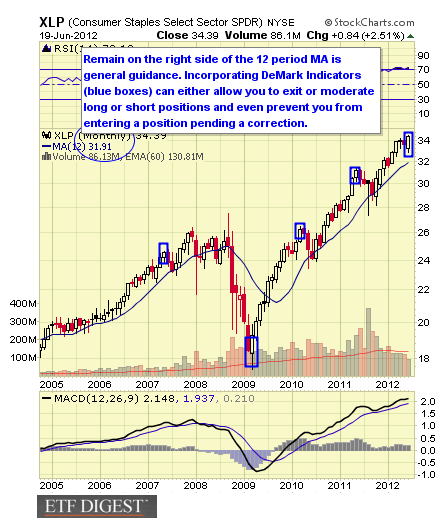
We feature a technical view of conditions from monthly chart views. Simplistically, we recommend longer-term investors stay on the right side of the 12 month simple moving average. When prices are above the moving average, stay long, and when below remain in cash or short if suitable to your tastes. Premium members to the ETF Digest receive added signals when markets become extended such as DeMark triggers to exit overbought/oversold conditions.
For traders and investors wishing to hedge, leveraged and inverse issues are available to utilize from ProShares and Direxion and where available these are noted.
#10: SPDR S&P International Consumer Staples ETF IPS

IPS follows the S&P Developed ex-U.S. BMI Consumer Staples Sector Index which represents non-U.S. consumer staples companies with market capitalizations of at least $100M. The fund was launched in July 2008. The expense ratio is 0.50%. AUM equal $18M and average daily trading volume is 3K shares.
As of June 2012 the annual dividend yield was 2.16% and YTD 0.73%. The one year return was -0.23%.
Data as of June 2012
IPS Top Ten Holdings & Weightings
-
Nestle SA (NSRGF): 15.30%
-
British American Tobacco PLC (BATS): 7.22%
-
Diageo PLC (DGE): 5.02%
-
Unilever NV DR (UNLNF): 4.43%
-
Anheuser-Busch Inbev SA (AHBIF): 4.39%
-
Unilever PLC (UNLYF): 3.63%
-
Danone (BN): 3.48%
-
Wesfarmers Ltd (WES): 3.15%
-
Imperial Tobacco Group PLC (IMT): 3.13%
-
Tesco PLC (TSCO): 2.92%
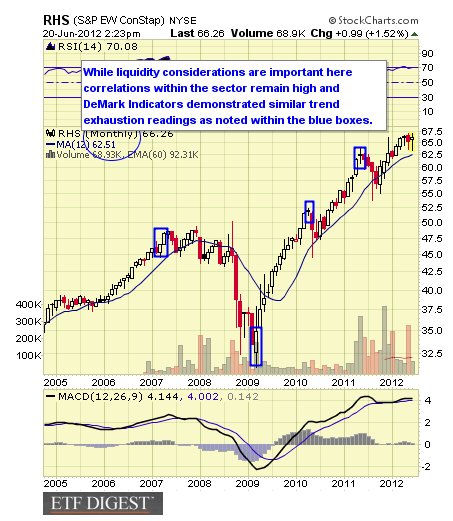
RHS follows the S&P Equal Weight Consumer Staples Index which as the name implies just breaks down the same sector ETF as XLP into equal weights. The fund was launched in November 2006. The expense ratio is 0.50%. AUM equal $43.1M average daily trading volume of 6K shares. The fund has struggled from a marketing perspective given company ownership changes which left it adrift for a period. This could now change with new ownership.
As of June 2012 the annual dividend yield was 1.95% and YTD 5.21%. The one year return was 8.42%.
Data as of June 2012
RHS Top Ten Holdings & Weightings
-
Dean Foods Company (DF): 3.15%
-
The Hershey Company (HSY): 2.72%
-
Kimberly-Clark Corporation (KMB): 2.68%
-
McCormick & Company, Inc. (MKC): 2.68%
-
Wal-Mart Stores Inc (WMT): 2.65%
-
Brown-Forman Corporation Class B (BF.B): 2.64%
-
Dr Pepper Snapple Group, Inc. (DPS): 2.62%
-
Beam Inc (BEAM): 2.61%
-
Coca-Cola Co (KO): 2.60%
-
PepsiCo Inc (PEP): 2.60%
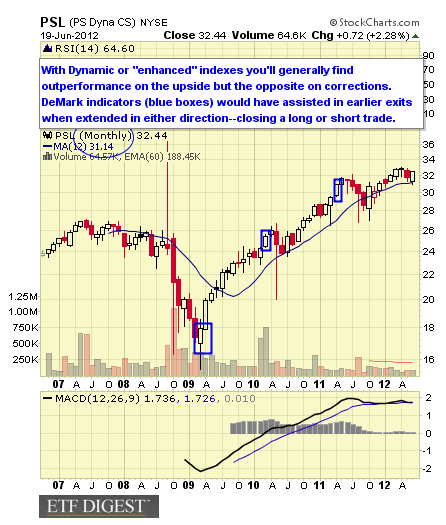
#8: PowerShares Dynamic Consumer Staples ETF PSL
PSL follows the Dynamic Consumer Staples Sector Intellidex Index which is considered an “enhanced” index since it uses proprietary quantitative analysis to more actively deploy and manage constituents. Of some interest are the more even weightings of the holdings versus others already listed. The fund was launched in October 2006. The expense ratio is 0.60%. AUM equal $38M with average daily trading volume of 3K shares.
As of June 2012 the annual dividend yield was 1.40% and YTD 3.36%. The one year return was 5.25%.
Another choice from the same sponsor is PowerShares SmallCap Consumer Staples ETF (PSCC)which follows the S&P SmallCap 600 Consumer Staples Index. The fund was launched in April 2010. Its expense ratio is 0.29%. AUM equal $30M and average daily trading volume is 11K shares. As of June 2012 the yield was just under 0.49% and YTD return 7.36%. The one year return was 6.82%.
Data as of June 2012
PSL Top Ten Holdings & Weightings
-
Estee Lauder Cos Inc Class A (EL): 2.86%
-
Coca-Cola Co (KO): 2.75%
-
Kimberly-Clark Corporation (KMB): 2.72%
-
Philip Morris International, Inc. (PM): 2.68%
-
Altria Group Inc. (MO): 2.67%
-
Kraft Foods Inc (KFT): 2.62%
-
Costco Wholesale Corporation (COST): 2.60%
-
PepsiCo Inc (PEP): 2.60%
-
General Mills, Inc. (GIS): 2.54%
-
CVS Caremark Corp (CVS): 2.52%
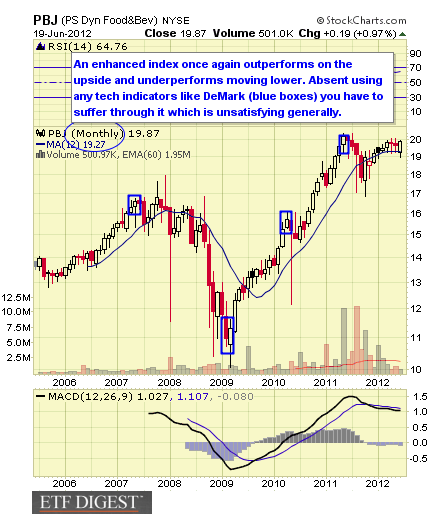
#7: PowerShares Dynamic Food & Beverage ETF PBJ

PBJ follows the Dynamic Food & Beverage Intellidex Index which another “enhanced” index from PowerShares that is more active in using quantitative analysis to select and manage the index. The fund was launched in June 2005. The expense ratio is 0.60%. AUM equal $158M and average daily trading volume is 37K shares.
As of June 2012 the annual dividend yield was 0.93% and YTD 3.13%. The one year return was 2.43%.
Data as of June 2012
PBJ Top Ten Holdings & Weightings
-
Yum Brands Inc (YUM): 5.64%
-
Mead Johnson Nutrition Company (MJN): 5.58%
-
Kraft Foods Inc (KFT): 5.35%
-
General Mills, Inc. (GIS): 5.18%
-
Kroger Co (KR): 5.03%
-
McDonald's Corporation (MCD): 4.94%
-
Archer-Daniels Midland Company (ADM): 4.90%
-
Monsanto Company (MON): 4.87%
-
Monster Beverage Corp (MNST): 3.20%
-
Papa John's International Inc. (PZZA): 3.03%
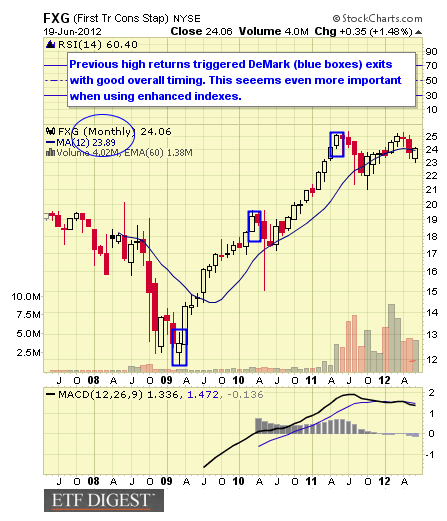
FXG follows the StrataQuant Consumer Staples Index which is another “enhanced” index which employs the AlphaDEX stock selection methodology to select consumer staples stocks from the Russell 1000. The fund was launched in May 2007. The expense ratio is 0.70%. AUM equal $382M with average daily trading volume of 208K shares.
As of June 2012 the annual dividend yield was 0.75% and YTD 1.69%. The one year return was -0.25%.
Data as of June 2012
FXG Top Ten Holdings & Weightings
-
Monster Beverage Corp (MNST): 5.01%
-
Herbalife, Ltd. (HLF): 4.90%
-
Corn Products International, Inc. (INGR): 4.74%
-
Tyson Foods, Inc. Class A (TSN): 4.57%
-
Smithfield Foods, Inc. (SFD): 4.56%
-
Bunge Ltd (BG): 4.52%
-
Constellation Brands Inc. Class A (STZ): 4.39%
-
Coca-Cola Enterprises Inc (CCE): 4.04%
-
Walgreen Company (WAG): 4.01%
-
Sara Lee Corporation (SLE): 3.93%

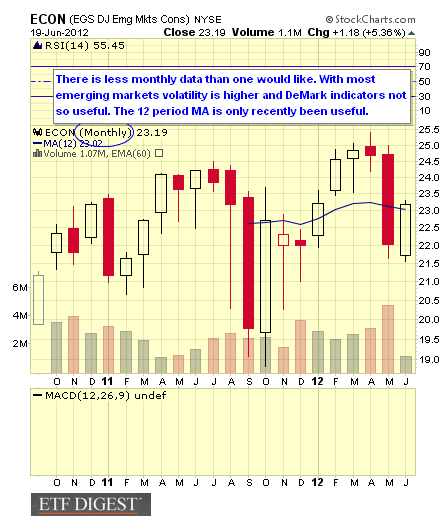
ECON follows the Dow Jones Emerging Markets Titans Index which is a market cap weighted index of the 30 leading emerging market companies in both consumer goods and services. The fund was launched in September 2010. The expense ratio is 0.85%.
AUM equal $402M and average daily trading volume is 151K shares. As of June 2012 the annual dividend yield was 0.54% and YTD return 3.91%. The one year return was 0.72%.
Data as of June 2012
ECON Top Ten Holdings & Weightings
-
Companhia de Bebidas das Americas Ambev ADR (ABV): 12.11%
-
Naspers Ltd (NPN): 9.21%
-
Fomento Economico Mexicano SAB de CV (FEMSA UBD): 7.22%
-
Wal - Mart de Mexico, S.A.B. de C.V. Class V (WMMVF): 6.33%
-
Astra International Tbk (ASII): 6.27%
-
Grupo Televisa, S.A. (TLEVISACPO): 5.18%
-
BRF - Brasil Foods SA ADR (BRFS): 4.98%
-
S.A.C.I. Falabella (FALABELLA): 4.93%
-
Cencosud SA (CENCOSUD): 4.21%
-
Genting Bhd (3182): 3.61%
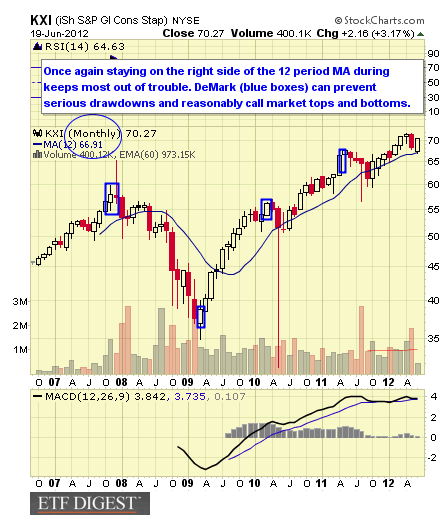
#4: iShares S&P Global Consumer Staples ETF KXI
KXI follows the S&P Global Consumer Staples Index which includes the U.S. and other nation’s consumer staples issues. The fund was launched in September 2006. The expense ratio is 0.48%. AUM equal $460M and average daily trading volume is 60K shares.
As of June 2012 the annual dividend yield was 2.23% and YTD return 5.02%. The one year return was 7.84%.
Data as of June 2012
KXI Top Ten Holdings & Weightings
-
Nestle SA (NSRGF): 7.48
-
Procter & Gamble Co (PG): 6.86%
-
Coca-Cola Co (KO): 6.77%
-
Philip Morris International, Inc. (PM): 5.83%
-
Wal-Mart Stores Inc (WMT): 4.60%
-
PepsiCo Inc (PEP): 4.26%
-
British American Tobacco PLC (BATS): 3.71%
-
Kraft Foods Inc (KFT): 2.70%
-
Altria Group Inc. (MO): 2.63%
-
Diageo PLC (DGE): 2.38%
IYK follows the Dow Jones U.S. Consumer Goods Index. The fund was launched in
June 2000. The expense ratio is 0.48%. AUM equal $403M and average daily trading volume is 28K shares. As of June 2012 the annual dividend yield was 1.54% and YTD return 5.32%. The one year return was 8.51%.
An alternative choice is FocusShares Morningstar Consumer Defensive ETF IYK which is a venture of Scottrade and Morningstar featuring a lower expense ratio (0.19%) and no trading commissions for Scottrade customers. The fund was launched in March 2011. AUM is $5.8M and average trading volume is 10K shares. You’ll no doubt see something similar coming from Schwab soon enough.
Data as of June 2012
IYK Top Ten Holdings & Weightings
-
Procter & Gamble Co (PG): 11.33%
-
Coca-Cola Co (KO): 10.33%
-
Philip Morris International, Inc. (PM): 9.63%
-
PepsiCo Inc (PEP): 7.02%
-
Kraft Foods Inc (KFT): 4.47%
-
Altria Group Inc. (MO): 4.36%
-
Colgate-Palmolive Company (CL): 2.91%
-
Monsanto Company (MON): 2.73%
-
Nike, Inc. Class B (NKE): 2.70%
-
Ford Motor Co (F): 2.61%
VDC follows the MSCI US Investable Market Consumer Staples 25/50 Index covering the entire spectrum of food, personal products, tobacco, beverage, drug stores and mega centers. The fund was launched in January 2004. The expense ratio is 0.19%. AUM equal $1B and average daily trading volume is 67K shares.
As of June 2012 the annual dividend yield was 2.18% and YTD return 7.13%. The one year return was 12.82%. VDC trades commission free at Vanguard.
Data as of June 2012
VDC Top Ten Holdings & Weightings
-
Procter & Gamble Co (PG): 12.04%
-
Philip Morris International, Inc. (PM): 9.88%
-
Coca-Cola Co (KO): 9.70%
-
Wal-Mart Stores Inc (WMT): 7.31%
-
PepsiCo Inc (PEP): 6.46%
-
Altria Group Inc. (MO): 4.39%
-
Kraft Foods Inc (KFT): 4.33%
-
CVS Caremark Corp (CVS): 4.03%
-
Colgate-Palmolive Company (CL): 3.27%
-
Costco Wholesale Corporation (COST): 2.72%
#1: SPDR Consumer Staples Select Sector ETF XLP
XLP covers the Consumer Staples Select Sector Index which includes food and staples retailing, household products, beverages, tobacco and personal products. The fund was launched in December 1998. The expense ratio is 0.18%. AUM equal $5.9B with average daily trading volume of 5M shares. As of June 2012 the annual dividend yield was 2.10% and YTD return 5.94%. The one year return was 12.32.
For traders and investors wishing to hedge, leveraged and inverse issues are available closely matching XLP’s performance to utilize from ProShares.
Data as of June 2012
XLP Top Ten Holdings & Weightings
-
Procter & Gamble Co (PG): 12.69%
-
Coca-Cola Co (KO): 12.51%
-
Philip Morris International, Inc. (PM): 10.76%
-
Wal-Mart Stores Inc (WMT): 8.50%
-
Altria Group Inc. (MO): 4.97%
-
PepsiCo Inc (PEP): 4.77%
-
Kraft Foods Inc (KFT): 4.67%
-
CVS Caremark Corp (CVS): 4.42%
-
Colgate-Palmolive Company (CL): 3.58%
-
Costco Wholesale Corporation (COST): 2.87%
We rank the top 10 ETF by our proprietary stars system as outlined below. However, given that we’re sorting these by both short and intermediate issues we have split the rankings as we move from one classification to another.
Strong established linked index
Excellent consistent performance and index tracking
Low fee structure
Strong portfolio suitability
Excellent liquidity

Established linked index even if “enhanced”
Good performance or more volatile if “enhanced” index
Average to higher fee structure
Good portfolio suitability or more active management if “enhanced” index
Decent liquidity


Enhanced or seasoned index
Less consistent performance and more volatile
Fees higher than average
Portfolio suitability would need more active trading
Average to below average liquidity


Index is new
Issue is new and needs seasoning
Fees are high
Portfolio suitability also needs seasoning
Liquidity below average


The consumer staples sector enjoyed a positive first half of 2011 but corrected with the overall market in the second half of the year. Now with 2012 half over we’re seeing a replay of 2011 possibly.
The consumer sector is marked by positive demographics overseas in emerging markets which has made ECON attractive even with the greater volatility. With the latter investors need to adopt more agile tactics as they should with enhanced index related ETFs.
For further information about portfolio structures using technical indicators like DeMark and other indicators, take a free 14-day trial at ETF Digest. Follow us on Twitter and Facebook as well and join our group conversations.
You may address any feedback to: feedback@etfdigest.com
The ETF Digest has no current positions in the featured securities.
(Source for data is from ETF sponsors and various ETF data providers.)
© 2024 Benzinga.com. Benzinga does not provide investment advice. All rights reserved.
Trade confidently with insights and alerts from analyst ratings, free reports and breaking news that affects the stocks you care about.

