Neighbor News
2014 Year in Review - Hoboken Real Estate - Where is the Market Going?
2014 Year in Review - Hoboken Real Estate - Where is the Market Going?

2014 was a tremendous year in real estate. Sellers had all the advantage with unbelievable bidding wars. Here are the trends and market performance analytics specially prepared for Hudson real estate monitor viewers. This is the first installment of the set of five article series for Hoboken and Downtown, Jersey City “Year in Review 2014”.
There were 1081 closing in 2014 which is approximately similar to 2013 with 1073 closing. Market maintained same trend as of 2013, which was 34% higher from 2012 with 803 closing. This includes condos and 1-4+ families sales.
I like to look at price per square foot by contract date. The price per square foot by contract date is a more accurate depiction of pricing because it’s the contract date where the buyer and the seller have come together and agreed on a price of a specific property. It takes 4 to 8 weeks to close depending on whether it’s a cash deal and how unique the property is. That is, a 1-4 family, generally, takes more due diligence than a condo.
_________________________________________________________________________
 today!_________________________________________________________________________
There are a variety of reasons why a closing may take longer than this. One typical reason why the time from contract to closing takes longer than this 6-8 week period is because the unit goes under contract in pre-construction. A property sold in pre-construction can remain under contract for 6-8 months or even more. Because the decision point to buy and the agreed upon price were made so far in advance of the closing, the price is not necessarily a reflection of pricing at that time of the closing.
As shown in above charts, The price per square foot for a 3 bedroom condo started from $652 in the month of January, went lowest during March at $487 and highest in Sep at $675. During last quarter, the Price per square foot for a 3 bedroom condo went from $675 to $649 to $588 to $545 in September, October, November and December respectively. The average price per sq feet for 2 bedroom over the period was $596 which is 13% higher from 2013 with an average of $528. In September, the average 2 bedroom went for $676,785, $622,100 in October, and $717,678 and $698,661 in November and December respectively. Year high for 2 Bedroom was at $717,678 in November, which is just similar to last two years trend.
Overall, prices have ticked up and this is not surprising given low inventory levels. We started the year at 169 houses for sales in January listings in Hoboken, peaked in May at almost 215,and ended at 112 units available for sale.
The demand for investment properties still continues to climb. Anecdotally, investors seem to think this is the sweet spot between prices, financing and upside potential for rents. All shapes and sizes are looking for investments - large property owners, individuals who want just one or two units for supplemental income.
The Highest sales volume was recorded during spring and summer with July recorded highest sales at 125 properties sold and the least sales in the month of February with 57 properties. Usually winter is known for less numbers but Dec 2014 recorded 100 units sold and rank fifth highest.
346 total condo units sold in 4th quarter (September - December), 157 were 2 bedrooms comprising 45% of the total volume. The 2 bedroom continues to be the most sought after unit size..
3 and 4 bedrooms are too low in terms of units to determine any meaningful trend here but there is enough volume in the one and 2 bedrooms in terms of number of closings. The duration measures the time the listing went up to the time the unit went under contract. Duration for 2 bedrooms went from 25 days, to 28 days to 23 days, to 32 days , during September to December period.
The duration for 1 bedrooms went from 37, 51, 42 to 61. This is significant and is a correlate with increasing prices. Increasing prices meansbuyers want to get through contract negotiations and attorney review quickly. There is likely less quibbling about inspection items.
Here is the price per square foot chart that shows how prices have ticked up ever so slightly.
All and all the market needs listings. If you are ready to move and you have waiting for a good time to list, this is it. Here is the unit sold by bedroom per month graph for 2014 for detailed overview. 
The average absorption rate during 2014 was 2.64 months for Hoboken, NJ. The absorption rate is a number that describes how many months it will take to see off the current inventory at the current rate of sales.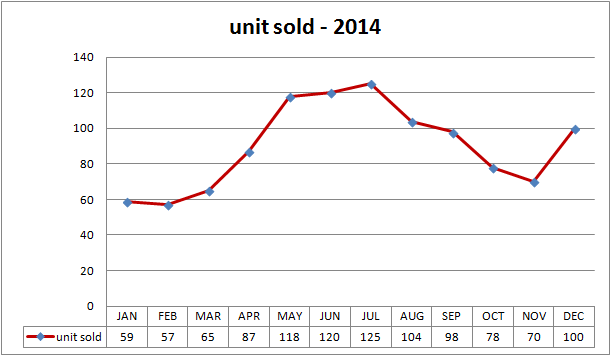
Jan and Feb were lowest with 59 and 57 closing respectively during 2014. Summer remain the best choice for buyers and sellers with highest closing during that period.
All and all the market needs listings. If you are ready to move and you have waiting for a good time to list, this is it.
Stay tuned for JC results on next Monday......
Find out what's happening in Hobokenwith free, real-time updates from Patch.
Information Provided by Donna Antonucci
Weichert Realtors


.jpg)


