On March 20, 2015, global gold price discovery changed. Transparency was introduced to the London gold market, as the new “LBMA Gold Price” was launched.
In my professional opinion, the changes in London are ushering in an entire new era of gold price stability, consistency, and transparency, and that will attract large money managers to this spectacular asset.
The tortoise always beats the hare. Allow me to elaborate: while net gains of $1 - $2 a day in the price of gold may seem boring, with roughly 250 trading days in a year, that can translate into price appreciation of $250 - $500.
When the Western fear trade dominated gold, the London gold price was set by shadowy figures making private telephone calls to each other. Volatility was huge, and many money managers used large bank loans to make leveraged bets on the price.
Now, the Eastern love trade is starting to overwhelm the fear trade. It’s a theme that will probably accelerate very dramatically in the second half of this year.
Also, the transparency in London will attract unleveraged money managers that take a very long term approach to their investments, with a focus on gold stocks.
Without the Eastern love trade, gold probably would trade in the $700 - $1000 area, if another financial crisis didn’t occur. That’s because Western fear traders simply don’t buy enough tonnage to overwhelm mine and scrap supply, except in the most extreme and temporary situations.
In contrast, the Eastern love trade should produce consistent 5% - 15% annual gold price appreciation, with very limited volatility, for decades to come. I expect to see gold stocks make a “stealth” change over the next 1 -2 years, from being the most hated asset class in the world, to one of the most respected.
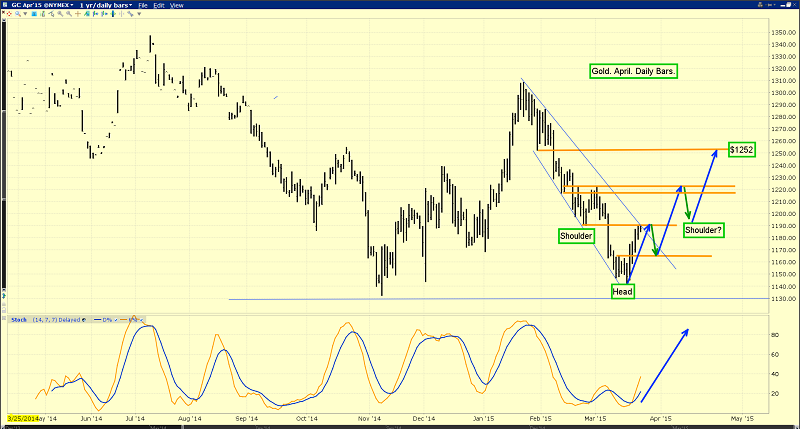
That’s the daily chart for gold. There’s a strong possibility that an inverse head and shoulders bottom is forming now.
Gold may react a bit here in the $1190 area, because of minor trend sell-side HSR (horizontal support and resistance). After the pause/pullback, I expect the rally to continue. Gold should reach $1220, before another pause in the upside action occurs.
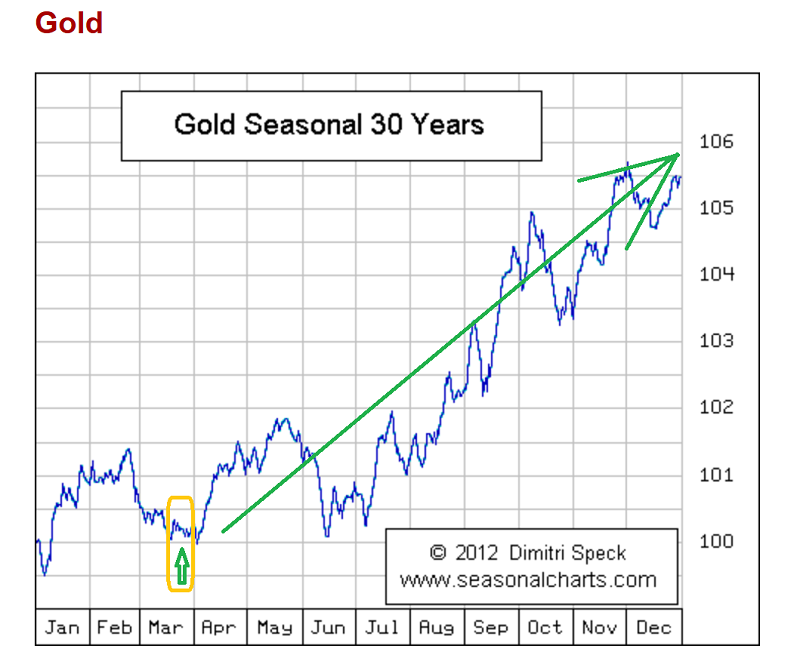
That’s the seasonal chart, courtesy of Dimitri Speck. Clearly, gold needs to be accumulated, on any short-term weakness.
There’s more good news in the immediate term, for gold price enthusiasts. March 26 is option expiry day for the COMEX April gold contract. That’s just two days from now, and gold often tends to rally after the options expire.
I recently swapped some gold for silver. Silver is referred to as a “game” by many hedge fund managers, but I think they may need to reconsider the use of that moniker. That’s because the increased transparency in the London market applies to silver as well as gold.
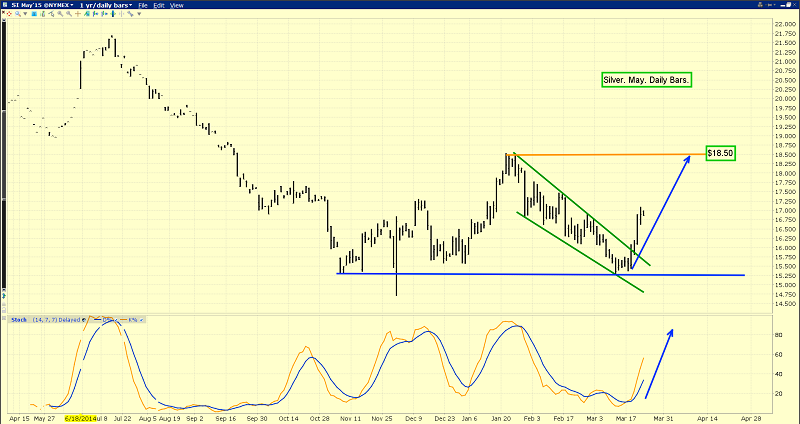
That’s the daily chart for silver. There’s a great breakout in play, from a bull wedge pattern. Silver could reach the $18.50 area quite quickly, once the March 26 option expiry day is in the past. Traders should book decent profits in the $17.50 - $18.50 zone.
A lot of analysts believe that Chinese gold demand is much higher than is reported in the mainstream media. I think they may be looking at a tree, rather than the forest. Here’s why:
The London gold market needed to be overhauled, and it was, but Shanghai also lacks transparency. A new “Shanghai Gold Fix” should be operational before this year ends, and I expect it to feature the same transparency that now exists in London.
Once the Shanghai market becomes as transparent as London, there will tremendous pressure on the New York COMEX directors, and on US commodity regulators, to bring that market to the level of excellence showcased in London and Shanghai. In 2016, Dubai should also get recognition as another major centre of transparent gold price discovery.
Most investors in the gold community believe America will experience another major financial crisis that will result in tremendous money printing, and higher gold prices. Financial meltdowns will occur repeatedly in the future, but when the next one will actually arrive, is perhaps more difficult to discern than most analysts are willing to admit.
What is crystal clear, is that the general industrialization of China and India, regardless of economic cycles, is a long term process that is increasing gold demand from both Chindian citizens and central banks. With gold markets around the world entering a fabulous new era of “growth with transparency”, gold stocks are poised to receive enormous inflows of institutional capital.
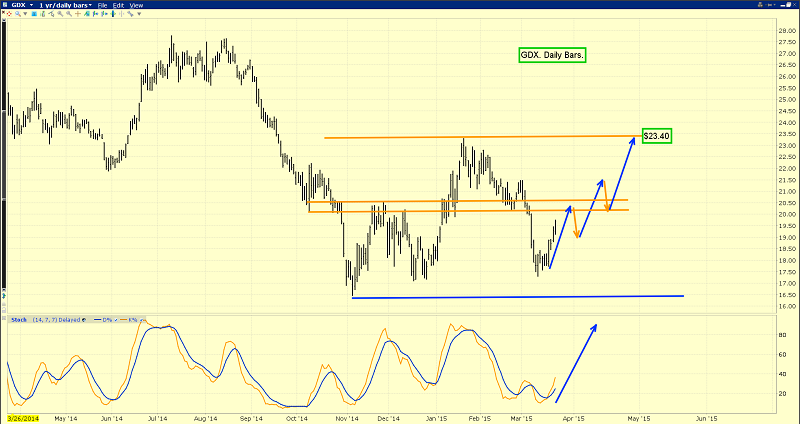
Market Vectors Gold Miners (ARCA:GDX) is a key holding for me. This daily chart shows the 14,7,7 Stochastics oscillator in rising mode, with the lead line only at about 38. There’s plenty of room for higher prices before that key oscillator becomes overbought. I think GDX can reach $23.40 if gold reaches $1250. If gold can reach the recent highs of about $1308, GDX should trade near the summer highs in the $27 zone.
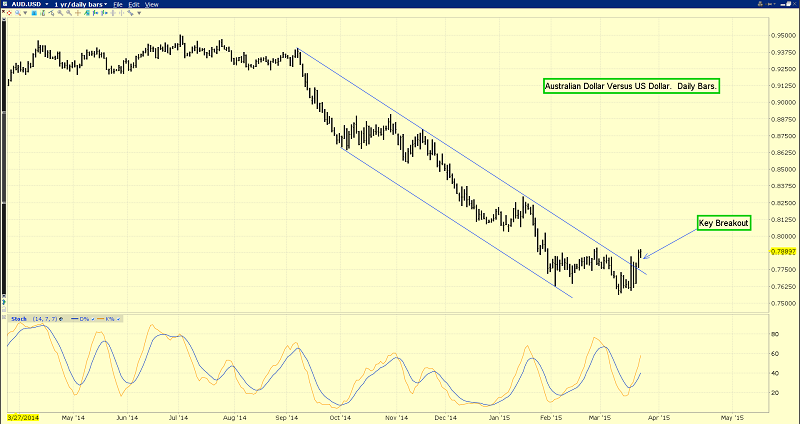
That’s the daily chart of the Australian dollar, against its US counterpart. There’s a key breakout in play.
Australia is viewed as part of the Western world, but its geographic location force the country to benefit from the staggering growth occurring in China and India.
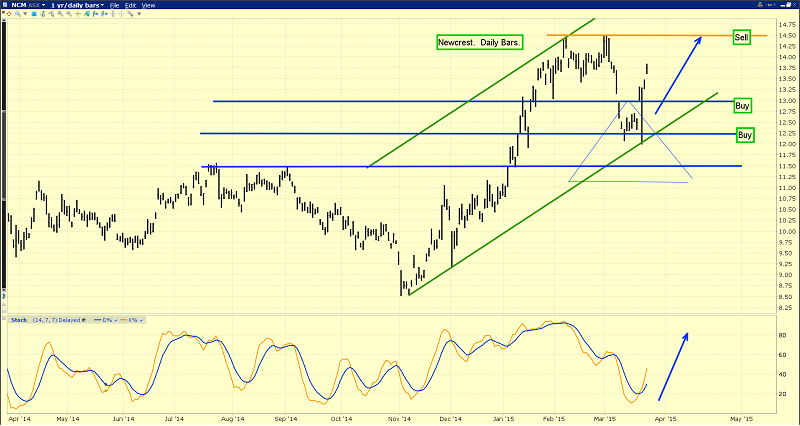
A rally in the Australian dollar at the same time as Australian gold stocks rally could create substantial profits for investors based outside of Australia. That’s the daily chart for Newcrest Mining (ASX:NCM), one of the world’s top-ten gold producers.
The company has roughly a twenty-five year mine life, which should produce enormous returns for shareholders, in the Chindian-based “gold bull era”. I recommended buying the stock at $13, $12.25, and $11.50, and two of those three buy points were hit, before the stock blasted higher in the past few days. Still, I will caution traders not to get greedy; some profits should be booked, as the stock approaches the $14.50 area.
As this year proceeds, I think Western gold stock investors will find themselves in a fresh new mindset. Fear of lower prices and demands for much higher ones will be replaced with strong confidence, as gold stocks stage a “choo choo train” advance on the price grid, to nicely higher prices!
Written between 4am-7am. 5-6 issues per week. Emailed at aprox 9am daily.
Stewart Thomson is a retired Merrill Lynch broker. Stewart writes the Graceland Updates daily between 4am-7am. They are sent out around 8am-9am. The newsletter is attractively priced and the format is a unique numbered point form. Giving clarity of each point and saving valuable reading time.
Risks, Disclaimers, Legal
Stewart Thomson is no longer an investment advisor. The information provided by Stewart and Graceland Updates is for general information purposes only. Before taking any action on any investment, it is imperative that you consult with multiple properly licensed, experienced and qualified investment advisors and get numerous opinions before taking any action. Your minimum risk on any investment in the world is: 100% loss of all your money. You may be taking or preparing to take leveraged positions in investments and not know it, exposing yourself to unlimited risks. This is highly concerning if you are an investor in any derivatives products. There is an approx $700 trillion OTC Derivatives Iceberg with a tiny portion written off officially. The bottom line:
Are You Prepared?
