Lou,
Love your analysis! Back in 2009, you did a thorough and accurate analysis for my inquiry on BXI and NEM. Given the recent pullback in energy, the stock price, change to a more solid management, and divestiture/acquisition of assets, I've been really tempted to purchase Encana on a dollar cost average. What are your thoughts on the short and long term? Thank you.
Lalit
Hey Lalit,
Thanks for the assignment and your kind words. This will be the third time that I look under the hood of EnCana Corporation. The last analysis was conducted on May 27, 2013 on a request from Tim. He had bought the shares at $19.77 and wanted my input on whether he should be patient or cut his losses. The stock was trading for $20.28 and the research indicated that it had established a range bound pattern. Support was identified at $18.25 and resistance was coming in along the 200-day moving average. It was advised that the best approach to managing the shares was to trade it in the range until there was greater visibility as to direction.
In hindsight, that was the correct call.
ECA broke above the 200-day moving average with conviction in January, 2014, reaching a 52-week high of $26.85 by June. From there, the shares were beaten down to a 52-week low of $13.31 by December as they suffered with the rest of the energy industry as oil prices collapsed.
Another investigation of the charts will inform my thoughts on how to proceed with ECA.
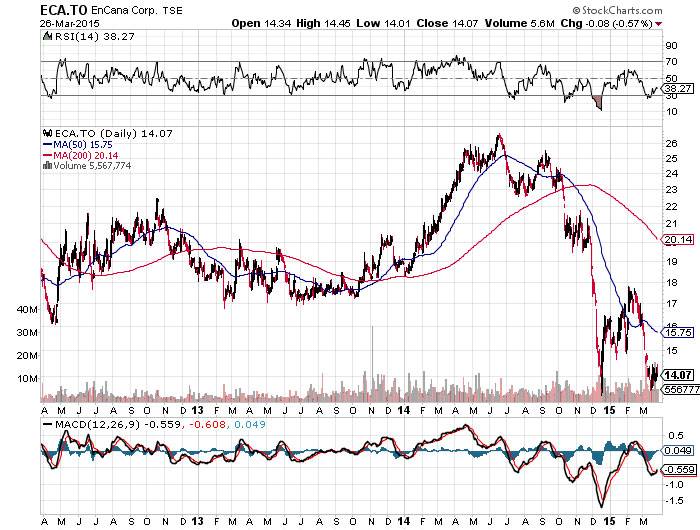
The three-year chart exhibits a number of patterns that need to be respected. The first is the waterfall decline that started in early October of 2014 and the death cross that formed later in the month. By the end of November, the shares breached support at $20.00, and within three weeks made their way to the 52-week low. The MACD and the RSI generated buy signals in mid-December as the stock became oversold, attracting the brave who saw value at those levels.
ECA ran to near $18.00, but the advance was short-lived. The MACD and the RSI generated sell signals as the stock pulled back to current levels.
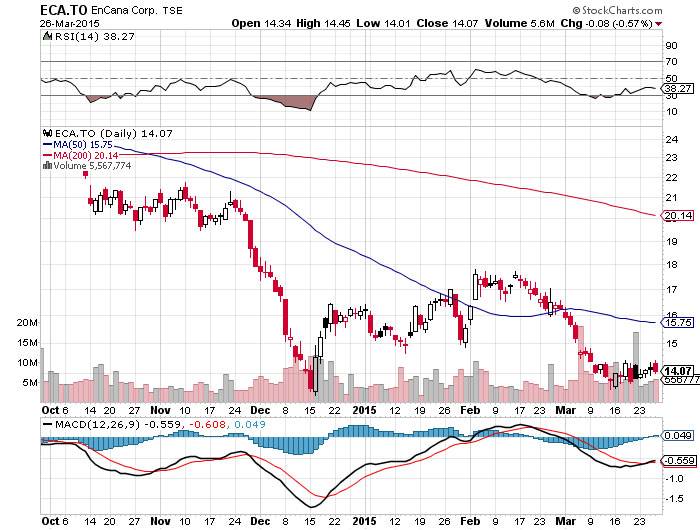
The six-month chart provides a close-up of the oversold situation that developed in December and the resistance that formed near $18.00 in February. At the moment, there are no clear indications that ECA is ready to move higher in the short term. If you are bound and determined to accumulate ECA on this bottom fishing expedition. Take a smaller position now, and keep the rest of your powder dry until we see if hold at these levels or retest support near $12.00. In most cases, I recommend averaging in as a stock climbs not chasing it on the way down.
Next time I will analyze Graphene 3D Labs Inc. for Cecile.
Make it a profitable day and happy capitalism!
Have your own question for Lou? Send it in to lou@happycapitalism.com.