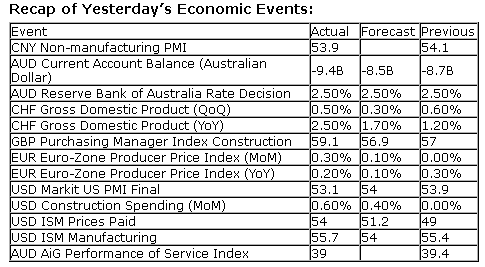
- Motor Vehicle Sales for August will be released throughout the day. The market expects 15.8M versus 15.7M previous.
- Trade Balance for July will be released at 8:30am. The market expects -$39.0B versus -$34.2B previous.
- The Fed’s Beige Book for September will be released at 2:00pm.
- Bank of Japan Rate Announcement will be released. The market expects no change at 0 to 0.1%.
- India Services PMI for August will be released at 1:00am EST.
- German PMI Services for August will be released at 3:55am EST. The market expects 52.4 versus 51.3 previous.
- Euro-Zone PMI Services for August will be released at 4:00am EST. The market expects 51.0 versus 49.8 previous.
- Great Britain PMI Services for August will be released at 4:30am EST. The market expects 59.8 versus 60.2 previous.
- Euro-Zone GDP for the Second Quarter will be released at 5:00am EST. The market expects a year-over-year decline of 0.7% versus a decline of 1.2% previous.
- Euro-Zone Retail Sales for July will be released at 5:00am EST. The market expects a year-over-year decline of 0.6% versus a decline of 0.8% previous.
- Canadian Trade Balance for July will be released at 8:30am EST. The market expects -$250M versus -$470M previous.
- Bank of Canada Rate Decision will be released at 10:00am EST. The market expects no change at 1.00%.

The Markets
Stocks posted gains for the first trading session of September, however, equity benchmarks closed well off of their highs as support grew for a strike on Syria. At the highs of the session, the S&P 500 was up around 1.10% as traders covered negative bets initiated during Friday’s session. As concerns once again escalated that an outbreak of war was imminent, stocks shed almost two thirds of the gain achieved around the opening bell. The S&P 500 ended at its 100-day moving average, a level that has acted as resistance over recent days. Short-term consolidation on the chart is giving indications of a bear flag pattern, which suggests another leg lower to follow. The 20-day moving average continues to point lower and is now intersecting with the 50-day average in what appears to be an imminent bearish crossover. With the weakest period for stocks, from a seasonal perspective, directly ahead and fundamental uncertainties growing, caution remains warranted.
Turning to the bond market, US treasuries sold off as stocks pushed higher. The yield on the 10-year note once again touched resistance at 2.9%, a critical level marking one of the last lines in the sand of the tremendous multi-year bull market for bonds that really gained legs starting in 2007. Negative momentum divergences on the chart of the 10-year yield suggests that recent positive pressures on the cost of borrowing may be fading, an event that typically precedes a change of trend. Should fear and panic escalate within equity markets, investors may flock back to the bond market, bidding up prices and pushing down yields, in order to sit out the storm. Seasonal tendencies remain positive for fixed income asset prices through to the end of the year.

And finally, an interesting sentiment/economic strength indicator in the commodity market is showing a potentially bearish setup. Copper has underperformed gold over the last few weeks, charting what appears to be the right shoulder of a head-and-shoulders topping pattern on the chart of Copper versus Gold. The relative underperformance of Copper coincides with the period of seasonal weakness for this industrial metal; between the start of September and the end of November, Copper declines around 8%, on average, relative to Gold. Despite some optimistic manufacturing reports over recent days that are conducive to higher Copper prices, the performance relative to Gold looks weak, suggesting that seasonal norms are likely to materialize. September is by far the weakest month for the relative performance of the industrial metal and a break below the neckline of the head-and shoulders pattern suggests downside potential of 8% in the Long Gold/Short Copper trade, consistent with seasonal norms. The implications of a move like this is risk aversion, whereby investors are likely to sell stocks, possibly in high beta sectors. The setup for seasonal weakness and volatility for risk assets, such as stocks and commodities, remains intact, which could mean treacherous sailing ahead.
Seasonal charts of companies reporting earnings today:


Sentiment on Tuesday, as gauged by the put-call ratio, ended bullish at 0.75. Just one session following an overly bearish reading, an overly bullish reading is revealed as investors were forced to cover hedges initiated prior to the long weekend. This reading is back to one of the lowest levels of the year, which suggests complacency, never a good thing to see with tremendous uncertainties all around.


