Mining giant Barrick Gold Corporation (USA) (NYSE:ABX) is set to report its first-quarter results after the closing bell Monday night. And while its underlying business of digging for gold and other precious metals has long lost its luster with all but the most ardent gold bugs, a turnaround, a couple times over, is in the works and incentive for bulls to put ABX on the radar.
![]() In front of Monday night’s announcement, Wall Street expects Barrick Gold to produce earnings of 10 cents a share, a drop from 20 cents in the same quarter a year ago.
In front of Monday night’s announcement, Wall Street expects Barrick Gold to produce earnings of 10 cents a share, a drop from 20 cents in the same quarter a year ago.
Profit surprises over the past year of 5%, 19% and most recently 25%, as well as one bottom-line match have resulted in mostly muted and unimpressed ABX stock reactions of -2%, -2%, -4% and 5%.
The price action in ABX shares has resulted in an average and quiet return of -0.75% if calculated using up and down trader reactions. Stripping out direction and using an absolute value, ABX has averaged 3.25% with a one standard deviation of 1.5%.
Possibly more important in Barrick Gold turning it around for ABX shareholders will be its ability to provide a positive update on the company’s turnaround, especially given an uproar over executive compensation.
According to Motley Fool, ABX shareholders will likely be focused on whether recently appointed Chairman John Thornton’s ‘three-pronged’ approach of rebuilding Barrick Gold’s highly entrepreneurial business model, cutting long-term debt by $3 billion and turning itself into a best-in-class capital allocator, is moving along in the right direction.
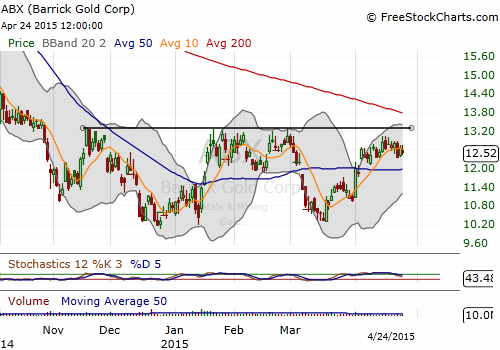
Click to Enlarge
We can see shares of ABX have spent nearly six months consolidating between $10.25 and $13.25 in the shape of a double bottom or W pattern.
The bullish price action in ABX is preceded by a three-year decline from around $56 whose downtrend line on the monthly time frame (not shown) has been broken by the current bottom trying to develop. Additionally, the long-term chart’s Stochastics is showing a positive crossover from oversold levels.
If the turnaround is to take hold with Monday’s earnings report acting as a catalyst, pattern resistance near $13.25 in ABX will need to be cleared. That’s roughly 6% above Friday’s close in ABX stock and would require a larger-than-normal reaction by bulls based on our review of recent reactions in shares of ABX.
That said, fellow miner Newmont Mining Corp (NYSE:NEM) dug out of its own technical hole Friday as shares gained more than 6% on its profit beat.
ABX Volatility and Options

Over the past year volatility readings in ABX stock and its options have ranged from the 20s to the mid-60s and both of which are historically extreme. On the other hand, current levels in the high 30s to low 40s more or less in the middle of that range and fairly ordinary.
Based on Friday’s implieds in the May contract, 42% implied volatility suggests shares of ABX have a 68% likelihood of remaining between $11.30 and $13.70. That’s about 9.5%, down or up, from $12.50 through expiration.
Activity in ABX options has also been mostly subdued and not indicative of any fresh and notable positioning by traders. However, decent open interest of about 14,000 in the May $14 call and 17,000 in the May $11 put can be appreciated as working to keep the slightly tighter estimated range intact.
ABX Bull Call Vertical
After checking the option board, which includes active weeklys and half-point strikes and given implieds and our technical view ABX is bottoming but will likely be facing a contained upside reaction, bull verticals are attractive. One favored spread is the May $12.50/$13 bull call spread.
At last check, this near-the-money vertical is priced for 28 cents. The debit results in a breakeven of $12.78 and a maximum risk of just more than 2% of ABX stock price. At the same time, this bull call spread can turn a profit of 22 cents or return of 72% above $13, which is just 1% away and ‘safely’ below pattern resistance of $13.25.
As of this writing, investment accounts under Christopher Tyler’s management do not currently own positions in any of the securities or their derivatives mentioned in this article. The information offered is based upon his observations and strictly intended for educational purposes only; the use of which is the responsibility of the individual. For additional market insights and related musings, follow Chris on Twitter @Options_CAT