Las Vegas Sands (LVS) received a boost recently as reports circulated that Macau may lift its smoking ban on casinos. Las Vegas Sands is scheduled to report 2Q earnings some time this week (TBD). Analysts are expecting Las Vegas Sands 2Q earnings to come in at .61c per share on 3.04B in revenue. The last four quarters have been woeful for LVS and their stock has followed suit. According to Estimize, revenue has come in at least 3% short of estimates in each of the last four quarters.
LVS has been a miserable stock to own, but the stock has been showing signs of life as earnings approach. Shares are testing the dominant trend lower (which coincides with the falling 200 day moving average) – this area will likely be a battleground… and how it resolves may determine the stock’s next move. No doubt, this technical setup adds intrigue heading into Las Vegas Sands 2Q earnings report.
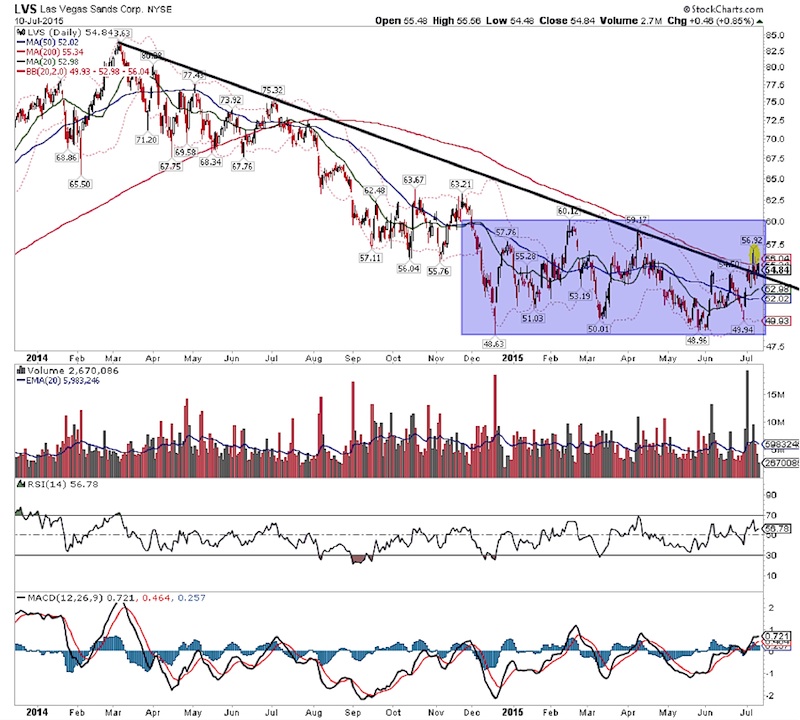
As you can see in the chart below, the stock is still trading within its 2015 range of $49-$60. It’s also worth pointing out that $54 and $63 appear to be key technical price levels.
Las Vegas Sands (LVS) Stock Chart
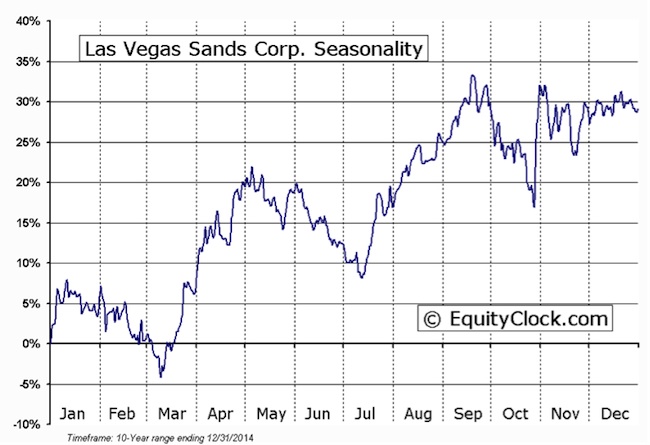
Looking at seasonality, we see a strong trend of strength starting right around earnings and lasting for a couple months thereafter. This could open up an opportunity on the long side as we head into late summer. That is, if LVS earnings isn’t a complete disaster.
Las Vegas Sands Seasonality Chart (source – EquityClock)
Thanks for reading and trade ‘em well!
Twitter: @ATMcharts
No position in any of the mentioned securities at the time of publication. Any opinions expressed herein are solely those of the author, and do not in any way represent the views or opinions of any other person or entity.


 Rolling Over At Key Fibonacci Level?")


