Today, synthetic polymers are utilized in a wide range of industries such as packaging, food and automotive. During manufacturing, the quality of plastic products mainly relies on the quality of the polymer blends or polymers used. It is important that these materials are subjected to proper verification and quality testing processes during each phase of production to ensure that only materials of highest quality are utilized.
Infrared Spectroscopy
Infrared (IR) spectroscopy is suitable for qualitative analysis of initial polymer materials and end products. With this technique, components of polymer mixtures can be measured and in-process samples can also be analyzed. This method is fast, reliable and cost-effective. In this article, a number of methods for the analysis and measurement of IR spectra of polymer samples are described in detail.
The Spectrum Two™ FT-IR spectrometer is a small, robust instrument that supports a wide range of transmission and reflectance sampling accessories, which are ideal for polymer analysis. This spectrometer is now supplied with a Polymer Resource Pack that offers the required data to create high-quality spectra.
Mid Infrared Spectroscopy
The positions of absorption bands in the spectrum give information about the presence or absence of specific functional groups in a molecule and as a whole the spectrum constitutes a “fingerprint” that can be used to determine the identity of the sample. The absorption band positions in the spectrum provide data regarding the absence or presence of certain functional groups within a molecule. Samples containing different components can be identified through a variation between two spectra.
The IR spectra of a number of standard polymers, such as polytetrafluoroethylene (PTFE), polystyrene (PS), polypropylene (PP), and polyethylene (PE), are shown in Figure 1. The PerkinElmer Spectrum Two FT-IR equipped with UATR sampling accessory is used to determine the IR spectra (Figure 2). Visual analysis of the obvious variations between the spectra makes it easy to distinguish the materials.
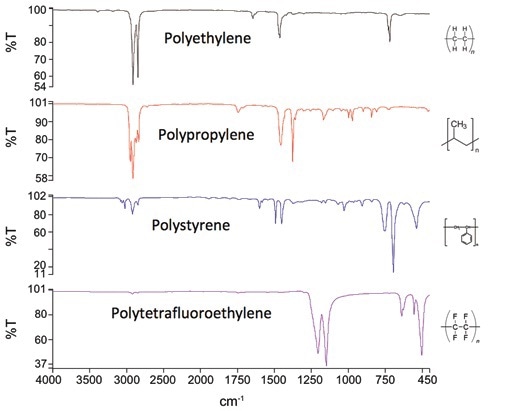
Figure 1. Mid-IR spectra of common polymers.
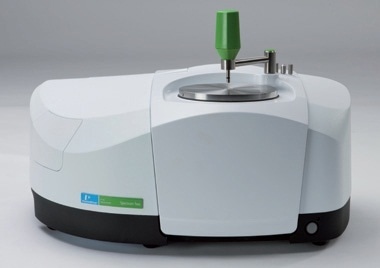
Figure 2. Spectrum Two FT-IR with UATR
Further spectral interpretation can provide structural data, for instance, while observing the C–H stretch region around 2950cm- 1, it is possible to view the difference between PP and PE because of the differing ratios of CH3 and CH2 groups. With bands over 3000cm-1, PS suggests the presence of aromatic groups, while C–H groups are not found in PTFE, and hence, the existing weak bands could be the result of surface contamination or impurities.
Sampling Methods
In order to obtain quality results, it is important to choose a proper sample preparation and sampling technique. However, the right method relies on the form, type and amount of sample that needs to be examined. Samples of polymer can take several different forms (Table 1).
Table 1. Sampling techniques for FT-IR spectroscopy of polymers.
| Sample Form |
Suitable Techniques |
| Thin films (<25 µm) |
Transmission |
| Fine powders (<2 µm) |
Transmission (KBr), ATR, DRIFT |
| Large items |
DRIFT (abrasive sampling) |
| Irregular shapes, pellets |
ATR, DRIFT (abrasive sampling) |
| Polymers soluble in volatile solvents |
Transmission (cast film) |
| Flat, reflective surfaces |
Specular reflectance, ATR, DRIFT (abrasive sampling) |
| Single fibers |
Diamond ATR or IR microscope |
For instance, a short pathlength is required to perform transmission measurements, and the same can be achieved by either acquiring a film via solvent casting (for soluble samples), or by pressing the sample onto a thin film. However, attenuated total reflectance (ATR) is a technique that is widely used to determine polymer spectra. Here, the sample is pressed against a compound, such as zinc selenide, diamond, or germanium crystal, and the evanescent wave absorption is subsequently determined. Requiring little to no sample preparation, this method generates high-quality spectra consistently. Diffuse reflectance (DRIFT) was previously used for polymers, but it continues to be a valuable method, where a sample can be collected by abrasion and the size of the sample is quite large to determine with the ATR technique.
The Polymer Resource Pack, available from PerkinElmer, gives complete instructions to acquire a high-quality spectrum for different types of samples using transmission and ATR methods. The pack comes with the Polymer ATR library, which can be utilized to establish the identity of samples. The following sections describe a number of sampling methods, where polystyrene is used as a reference material.
ATR
In this method, the sample was directly placed on the top plate of the UATR accessory, which in turn was mounted in the spectrometer’s sample beam. It took just 30 seconds to complete the measurements and gain the ATR spectrum (Figure 3).
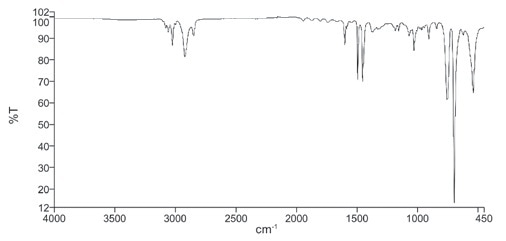
Figure 3. ATR spectrum of plastic sample
ATR allows short pathlength that makes it convenient to determine high-quality spectra. Due to this factor, ATR serves as an effective surface method. Some amount of sample preparation would be required if the sample's surface does not represent the bulk. If the sample is hard and not flat, achieving adequate contact with the crystal would be difficult. As a result, a general approach can be used. In the case of soft sample, a large amount of sample can be cut to prepare a flat polymer piece with a fresh surface and the same can be pressed against the ATR crystal. In the case of hard and spherical samples such as granulates, a pair of clean flat-nose pliers can be used to flatten the sample. The sample should be used as it is in all other instances.
Some amount of variations from transmission spectra are seen in the ATR spectra. Given that the effective pathlength inversely differs with wavelength, the bands observed at high wavenumber are comparatively weaker than in transmission. As a result, library searching would be affected, but this can be prevented by either using an ATR library or by applying an ATR correction to the spectrum before searching.
Film Casting
It was observed that the sample could be dissolved in xylene. Hence, a thin sample film was prepared using the following method:
- 2g of the sample is dissolved in 10mL xylene
- An IR crystal window is mounted on top of a paper towel on a hot plate is set to a temperature of 40°C.
- 2 to 3 drops of the sample solution are introduced on the crystal window
- The solvent is finally allowed to evaporate, leaving behind the thin sample film
- The thin film was placed in the IR beam and the IR spectrum was subsequently acquired (Figure 4)
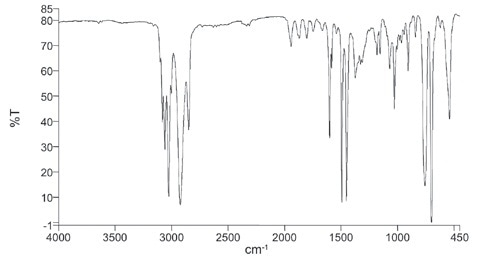
Figure 4. Transmission spectrum of plastic sample prepared as thin cast film.
This film casting approach is both easy and affordable, and is capable of creating a high-quality spectrum. However, a major drawback of this method is that it takes significant amount of time, and can only be used for soluble polymers.
DRIFT
An abrasive stick and a DRIFT accessory were used to perform DRIFT measurements of the same sample. A clean abrasive stick was used to obtain the background, and the same was rubbed over the sample and positioned in the DRIFT accessory. The resulting spectrum is illustrated in Figure 5.
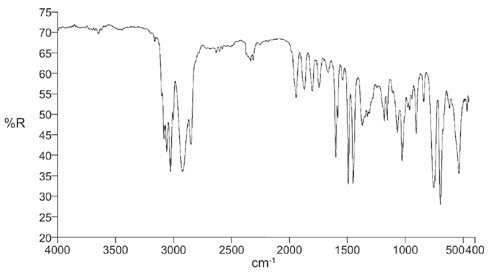
Figure 5. DRIFT spectrum of plastic sample.
In the case of large samples, DRIFT measurements with abrasive sticks offer an easy sampling option, but the disadvantage is that it is rather sensitive to the quantity of sample utilized. A considerable amount of skill is needed in contrast to the ATR sampling.
Identification of Industrial Samples
An automotive parts manufacturer supplied three samples, which included two black interior trim pieces and one plastic headlight cover, as shown in Figure 6. The IR analysis was mainly performed to detect these materials.
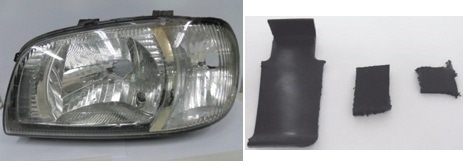
Figure 6. Automotive plastic samples. Left: headlight glass, right: interior trim parts.
Using the UATR accessory, spectra were acquired. Before analysis, the coating on the headlight cover was removed. The spectrum was then evaluated against the PerkinElmer ATR polymers library, by means of the Search function in Spectrum 10, as shown in Figure 7. The outcomes show that the sample is indeed polycarbonate. The PerkinElmer ATR polymers library is supplied with the Polymers QA/QC FT-IR Reference Pack.
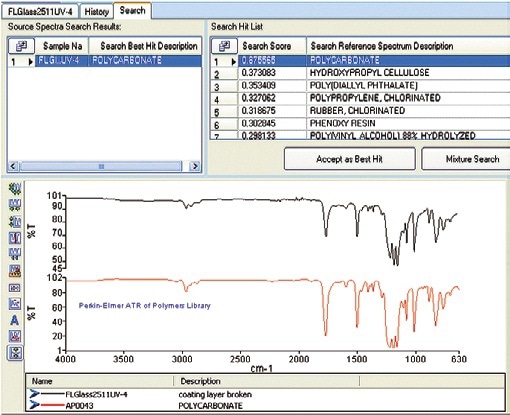
Figure 7. Search results for the headlight cover, showing a good match against the Polycarbonate reference
UATR accessory was used to determine the spectra of the black trim materials. Black materials typically need a relatively shorter pathlength than that provided by the diamond ATR, and also benefit from a germanium crystal. However, in this situation, reasonable spectra were acquired with the diamond, as shown in Figure 8.
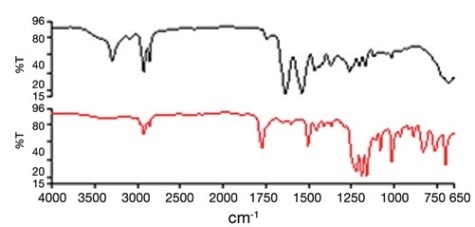
Figure 8. Mid IR spectra of auto-components. Top: sample 1, bottom: sample
The ATR Polymers library and the Search function of Spectrum software helped in identifying the materials as nylon and polycarbonate for Samples 1 and 2, respectively (Figures 9 and 10).
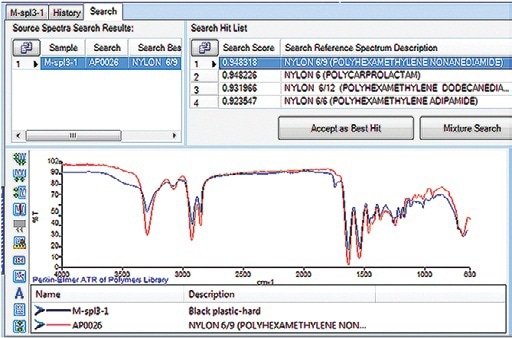
Figure 9. Sample 1 identified as nylon base material
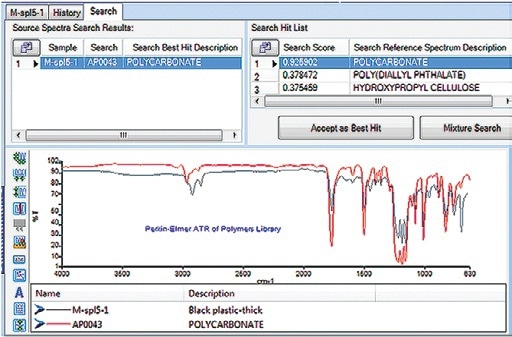
Figure 10. Sample 2 identified as polycarbonate base material
Conclusion
FT-IR spectroscopy serves as a suitable and effective method for polymer studies. As such, different types of sampling techniques exist with different degrees of time requirements and sample compatibility. Equipped with the Polymers QA/QC FT-IR Resource Pack and the UATR sampling accessory, the Spectrum Two FT-IR spectrometer is suitable for standard analysis and detection of polymer samples. In the case of ATR sampling, high-quality spectra were rapidly acquired from industrial samples, and material identification was made relatively easy by searching against the ATR library that comes with the FT-IR system.

This information has been sourced, reviewed and adapted from materials provided by PerkinElmer.
For more information on this source, please visit PerkinElmer.