How good were the employment reports of October and November? It depends who you ask. Those who believe the job market is dramatically improving want you to look at the raw number of new jobs created as well as the headline U-2 unemployment percentage; several hundred thousand jobs have been added to payrolls each month and the 7.0% unemployment “stat” represents a 5-year low. On the flip side, those who feel the job market is stagnant want you to examine the mass exodus from the labor force by working-aged individuals as well as the “quality” of the job creation itself; the unemployment rate adjusted for labor force participation is 11.0% while a scary percentage of the jobs created are part-timers in low wage positions.
For investors, the only real question is how it all plays out at the Fedreal Reserve. After all, the Fed’s emergency bond-buying policy (a.k.a. “QE”) is the primary driver of riskier assets. So what do most investors foresee? They anticipate an exceptionally accommodative central bank over the intermediate-term (4-6 months) that is likely to favor stocks. The belief stems from the fact that the Janet Yellen Fed is aware that real household income has fallen 4.4% over the course of the current economic recovery (6/2009-11/2013), suggesting that wage growth is weak and implying that employment well-being might be overstated. It follows that, while the most recent data are encouraging, the investing population is not expecting the Fed to make any huge changes.
(Note: Should Yellen and company reduce the electronic money printing from $85 billion per month to $75 billion sometime soon, this would not be a change in direction; rather, it would merely be an effort to walk the tightrope between acknowledging the need to move away from a 5-year rate manipulating endeavor and avoiding the consequences of a substantial spike in interest rates — a yield spike that the global economy is not presently capable of enduring.)
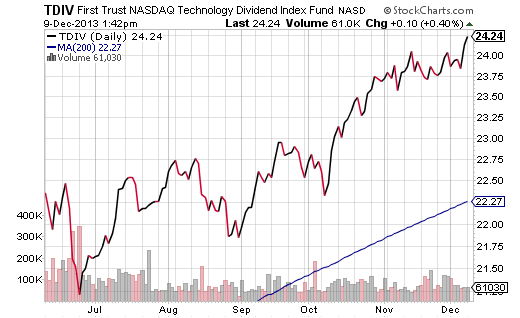
ETF advocates should not deviate far from their present invested positions as 2013 winds down. The Fed’s not genuinely backing off its stimulus in a meaningful way, minimal top-line revenue at corporations has not dissuaded anyone from “stocking up,” and all of the major benchmarks demonstrate powerful technical uptrends. If you’re holding what I’ve been holding throughout the year — funds like iShares Russell 1000 (IWB), iShares Small Cap Value (IJS), PowerShares Pharmaceuticals (PJP), First Trust NASDAQ Tech Dividend (TDIV) — simply make sure that you have a sell discipline in place should the tides turn. If nothing else, keep an eye on the price of your ETF relative to its long-term, 200-day moving average.

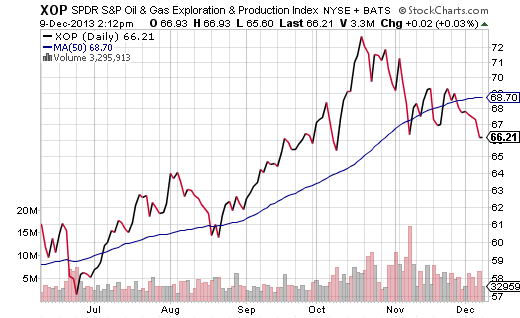
If you are sitting on tens of thousands (hundreds of thousands) of dollars in losses from previous years because you did not have a sell discipline to minimize the damaging effects of the 2008-09 financial collapse, there are ETFs worth selling. Take profits that you may have accumulated in the energy arena. Why? Many of them are showing weakness by slipping below shorter-term 50-day moving averages. For instance, SPDR Oil and Gas Exploration (XOP) has pulled back sharply from mid-October.

Locking in a profit does not mean that you will give up on the sector entirely. Continue monitoring the segment. Recognize that you have a variety of ETFs that will capture the same space. In the above-mentioned example, if you sell XOP to reduce risk and simultaneously harvest the gain, you should track several alternative exploration ETFs during your breather. If energy exploration continues to struggle, you would hold off from making a purchase, but if it manages to reclaim some of its swagger, iShares DJ Oil Exploration and Production (IEO) could easily be acquired.
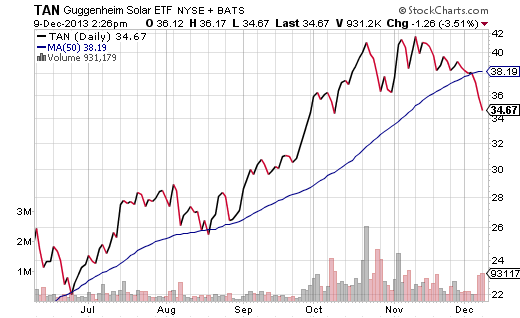
Solar energy also appears “toppy.” Admittedly, I never went near the industry. Nevertheless, if I were sitting on a tax loss carryover — and even if I weren’t — I might lock in my remarkable year-to-date profits in a fund like Guggenheim Solar (TAN). The near-term downtrend is evidence enough that I might want to take a break and revisit my premise. If TAN makes it through the current bout of profit-taking as well as recovers its 50-day, I might investigate Market Vectors Solar (KWT) or another alternative energy fund like PowerShares Wilderhill Clean Energy (PBW). If so desired, I could buy back in within 30 days. Or, after a wash sale period, I could return to TAN.

