Get 40% Off
👀 👁 🧿 All eyes on Biogen, up +4,56% after posting earnings. Our AI picked it in March 2024.
Which stocks will surge next?
Unlock AI-picked Stocks

3 Shocking Charts That Prove A Gold Rally Is Coming

Published 11/18/2015, 12:27 AM
Updated 05/14/2017, 06:45 AM

I thought I’d seen the most shocking gold chart this year. Turns out I was wrong.

Lately, I’m seeing one chart after another that paints a picture in stark contrast to current low prices in the metal.

Sales of U.S. Gold Eagles Are Soaring... And So Is Global Demand

Let’s start with the big one...
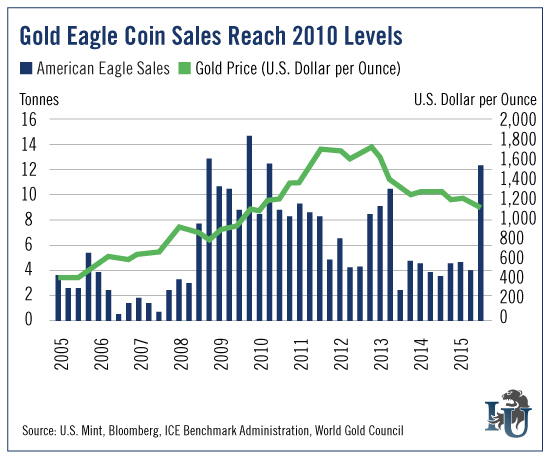
Gold Eagle Coin Sales Reach 2010 Levels chart

According to a new report from the World Gold Council, Americans are snapping up physical gold. Investment demand in the third quarter was astounding, with U.S. retail demand jumping to 32.7 metric tons.

That’s growth of more than 200% year on year.

“Demand for newly minted coins surged across all key product lines: sales across all denominations were many multiples of their long-term average levels,” the report adds.

The World Gold Council also noted that global demand for the yellow metal soared 33%...

After the U.S., the next biggest surge in demand was in China. Third quarter demand for gold in China jumped 70% to 52 metric tons.

China’s buying spree can be traced back to its surprise devaluation of the yuan this year. In addition, the roller-coaster ride in the Chinese stock market sent investors scurrying for a place to shelter their wealth. This one-two combo triggered a buying spree.

Europe also saw investors load up on gold, up 35% in the quarter to 61 metric tons. Europe has its own problems: The slumping euro... a misfiring economy... and a surge of refugees from the Middle East.

Buy gold? Damned straight!

Central Banks Are Buying Gold Hand Over Fist

3rd party Ad. Not an offer or recommendation by Investing.com. See disclosure here or remove ads .

In a move that surprises no one (except government economists who insist gold is a barbarous relic), central banks added to their gold reserves for the 19th quarter in a row.
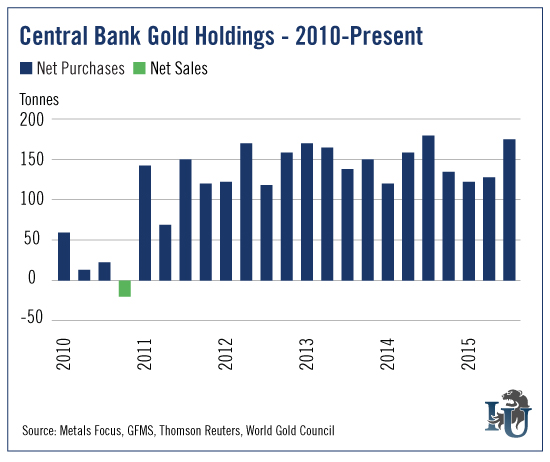
Central Bank Gold Holdings 2010 to Present chart

Central banks added 175 metric tons to their reserves in the most recent quarter. That’s HUGE.

A big part of this was the People’s Bank of China, which added 50.1 metric tons of gold to its holdings between July and September.

You’ll remember that in July, China’s central bank confirmed that its gold reserves had expanded by more than 50% since it last announced its holdings in 2009. The Chinese seem disposed to more regular updates now.

Another big buyer was Russia. At 77 metric tons, it was the quarter’s largest purchase. Vladimir Putin seems determined to have a currency that can’t be threatened by any manipulative move on the part of the Western powers.

And now to our last chart...

India Is Buying Lots of Gold Again

Gold demand in India jumped to 268.1 metric tons in the third quarter. That’s up 13% year over year. Consumers stocked up on gold after the yellow metal fell to a five-year low in July. Consumer Gold Demand in India 2014 to Present chart
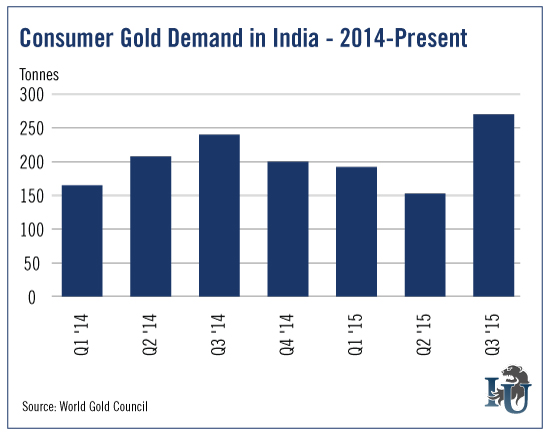
India’s demand for jewelry rose 15% in the third quarter. That was most of the rise in demand, which shows India’s consumers are back in a big way.

Upside Surprise

Let me give you one more bullish note...

October marked three months in a row that money has flowed into SPDR Gold Shares (N:GLD) ETFs. What’s more, between January and October this year, ETF holdings dropped 54 metric tons. That’s way down from the 133 metric tons during the same period in 2014. And it’s a huge drop from the 780 metric tons sold during the same period in 2013.

3rd party Ad. Not an offer or recommendation by Investing.com. See disclosure here or remove ads .

Bottom line: Demand for gold is coming back strong. Producers have been beaten over the head with shovels for so long that they won’t turn bullish until far too late. The potential for a big upside surprise in price is definitely there.

We don’t know when such a rally will come. But you’ll want to be well positioned when it does.

Latest comments

I also remember there was a well documented visit by CNBC's Bob Pisani to GLD's gold vault. This visit was organized by GLD's management to prove the existence of GLD's gold but the gold bar held up by Mr. Pisani had the serial number ZJ6752 which did not appear on the most recent bar list at that time. It was later discovered that this "GLD" bar was actually owned by ETF Securities.
I see you have some familiarity with GLD. I've been trying to do my due diligence on this fund for quite some time but have not been able to find any details on its insurance policies. Would you happen to know any details on this subject? This message I've been reading is very relevant and reflects my experience so far:. . "Did anyone try calling the GLD hotline at (866) 320 4053 in search of numerical details on GLD's insurance? The prospectus vaguely states "The Custodian maintains insurance with regard to its business on such terms and conditions as it considers appropriate which does not cover the full amount of gold held in custody." When I asked about how much of the gold was insured, the representative proceeded act as if he didn't know and said they were just the "marketing agent" for GLD. What kind of marketing agent would not know such basic information about a product they are marketing? It seems like they are deliberately hiding information from investors."
Risk Disclosure: Trading in financial instruments and/or cryptocurrencies involves high risks including the risk of losing some, or all, of your investment amount, and may not be suitable for all investors. Prices of cryptocurrencies are extremely volatile and may be affected by external factors such as financial, regulatory or political events. Trading on margin increases the financial risks.
Before deciding to trade in financial instrument or cryptocurrencies you should be fully informed of the risks and costs associated with trading the financial markets, carefully consider your investment objectives, level of experience, and risk appetite, and seek professional advice where needed.
Fusion Media would like to remind you that the data contained in this website is not necessarily real-time nor accurate. The data and prices on the website are not necessarily provided by any market or exchange, but may be provided by market makers, and so prices may not be accurate and may differ from the actual price at any given market, meaning prices are indicative and not appropriate for trading purposes. Fusion Media and any provider of the data contained in this website will not accept liability for any loss or damage as a result of your trading, or your reliance on the information contained within this website.
It is prohibited to use, store, reproduce, display, modify, transmit or distribute the data contained in this website without the explicit prior written permission of Fusion Media and/or the data provider. All intellectual property rights are reserved by the providers and/or the exchange providing the data contained in this website.
Fusion Media may be compensated by the advertisers that appear on the website, based on your interaction with the advertisements or advertisers.
© 2007-2024 - Fusion Media Limited. All Rights Reserved.