 CAC 40
 Talking Points
- The CAC 40 Trades Down -2.20%
- Price has Broken Pivot Support at 4,274
- SSI Reads Bearish at +2.67
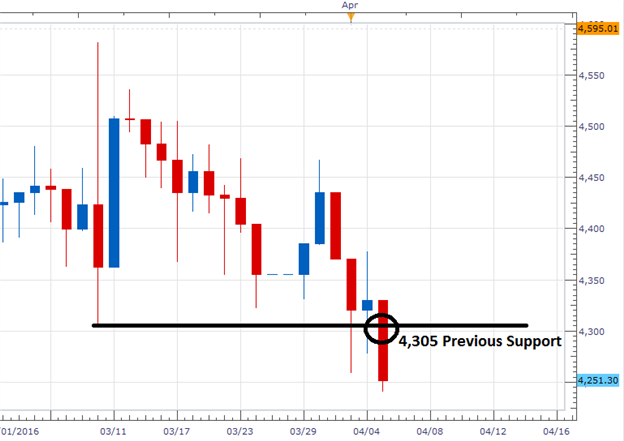
CAC 40 Daily Chart
(Created using Marketscope 2.0 Charts)
What is next for the equities market? Click HERE for our analysts Free forecast!
The CAC 40 has traded to a new monthly low this morning, and currently down -2.20% on the day. If prices close the day lower, this will mark the fourth daily decline in the last five trading days for the Index. Peugeot is leading the Index lower, trading off -5.79% so far. Currently Nokia is the only CAC 40 component trading higher, up 0.72%.
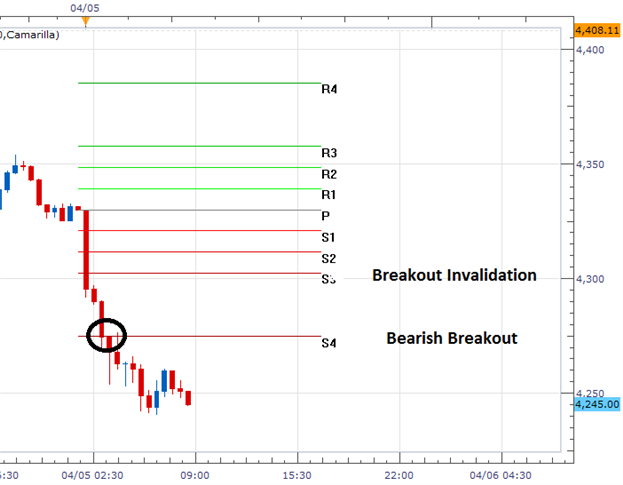
Technical traders should note that if prices close at present levels, it would represent the first daily close below the previously discussed value of range support at 4,305. Day traders should also note that prices are currently trading below today’s S4 Camarilla pivot, which is found at a price of 4,274. If prices continue to trade below this value, it opens the CAC 40 up for further declines on continued bearish momentum. In this scenario, traders may extrapolate today’s 55 point range to find initial bearish targets near 4,219.
In the event of a bullish reversal, traders should first look for prices to rise above the S4 pivot. If bullish momentum continues, this action should be followed by an advance above the S3 pivot at 4,302. A movement to this point on the chart would then open the CAC 40 to close back inside of the previously mentioned value of range support at 4,305. In this scenario, this morning’s bearish breakout would be considered invalidated.
CAC 40, 30 Minute Chart
(Created using Marketscope 2.0 Charts)
SSI (speculative sentiment index) for the CAC 40 (Ticker: FRA40) is currently reading at +2.67. This value has increased from +1.88 in our last report. When taken as a contrarian signal, this increase in sentiment may suggest a bearish bias for the Index. Alternatively, in the event of a bullish reversal, traders should look for SSI to move from its current positive extremes towards more natural values.
To Receive Walkers’ analysis directly via email, please SIGN UP HERE
See Walker’s most recent articles at his Bio Page.
Do you know the biggest mistake traders make? More importantly, do you know how to overcome the biggest mistake? Read page 8 of the Traits of Successful Traders Guide to find out [free registration required].
Contact and Follow Walker on Twitter @WEnglandFX.
original source


