

What is next for the FTSE 100 in 2017?
The FTSE 100 ended 2016 with an all time high of 7,142.

The flagship FTSE 100 index of the largest UK companies has ended 2016 with a bang, hitting an all-time high of 7,142 (see chart 1).
Great for UK investors of course, but is this really a reason to celebrate? With the index starting 2016 at 6,242, the 900-point gain over last year represents a healthy 14% gain.
What have been the principal drivers behind these 2016 gains? I would point to three factors:
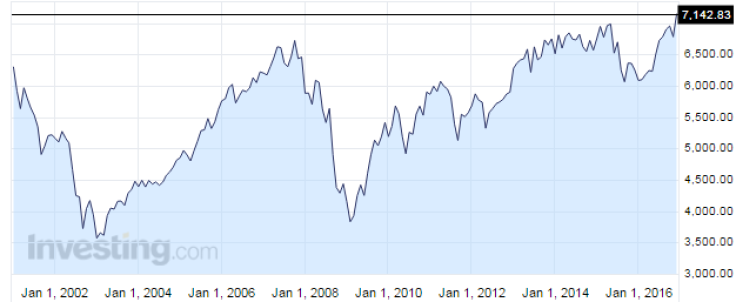
Chart 1: FTSE 100 at an All-Time High Source: investing.com A weaker pound boosting exports and the value of overseas businesses when translated back into pounds.
- A resurgence in both oil and industrial metals commodity prices since early in 2016, driving big gains in both Oil & Gas and Mining shares like BP and Glencore.
- Takeovers of FTSE 100 companies such as ARM Holdings (by the Japanese company Softbank) and Sky (by the US parent company News Corp.).
But Not as Impressive as Overseas Shares...

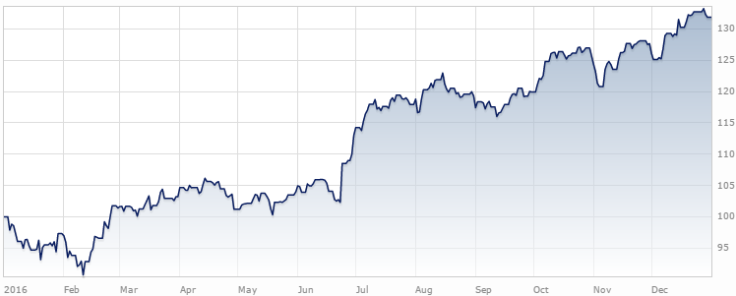
But this is actually not all that impressive, compared to other stock markets around the world. Take the example of our German cousins, for instance. Their flagship DAX index of the 30 leading German stocks has gained 22% over 2016 in pounds sterling, aided to a good extent by the weakness of the pound post the Brexit vote (see chart 2).
Then we could look across the Atlantic Ocean to our American cousins, to see that their benchmark S&P 500 index rose a hefty 32% in pounds over 2016 (see chart 3).
Next to these two international stock markets, suddenly the 14% gain in the FTSE doesn't seem quite so impressive.
Where would I look for gains in 2017?
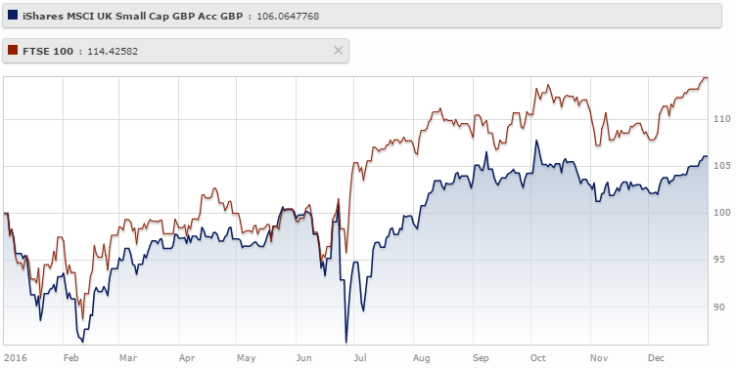
One area of the UK stock market that has lagged the FTSE 100 since the middle of 2016 has been the small-cap segment. Looking at the performance of the iShares MSCI UK Small Cap ETF for instance, we can see that it has eked out only a 6% yearly gain compared with more than double that for the large-cap FTSE 100 (see chart 4).
Many will argue that 2017 is not the moment to invest in smaller companies in the UK, given an expected slowdown in the UK's domestic economy over the year.
But I would suggest this is the area of the UK stock market where value is today to be found, as this under-performance against the FTSE 100 has all been caused by the immediate aftermath of the Brexit vote and the subsequent sharp drop in the pound's value.
Indeed, over the last few months, the UK economy has surprised almost everyone with its resilient growth in spite of uncertainties surrounding the Brexit process. Over time, if this pattern of domestic growth above expectations is maintained, then this should actually be better news for the more domestically-oriented small-cap stocks rather than their more international FTSE 100 brethren.
Two easy ways to invest in this small-cap market segment are the following stock market-listed funds:
- The iShares MSCI UK Small Cap ETF (UK code CUKS), which invests in an index of smaller-cap UK companies like tech company Micro Focus and property website Rightmove in a cheap exchange-traded fund format;
- The Invesco Perpetual UK Smaller Companies investment trust (code IPU), which invests in companies such as sports retailer JD Sports and internet clothes retailer boohoo.com; the fund focuses on quality smaller companies with strong balance sheets, which has produced impressive results over the past few years.
© Copyright IBTimes 2024. All rights reserved.


