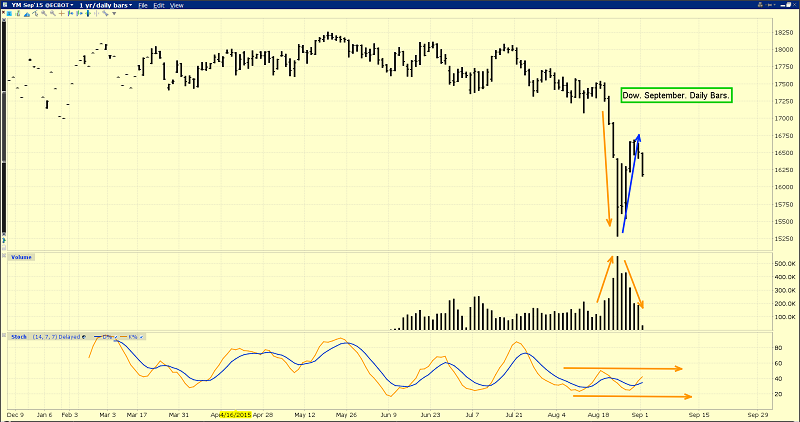
Welcome to September! That’s the daily Dow chart, above. In early morning futures market trading, the Dow is down about 330 points.
It’s a horrific start to the month, and it could get much worse. Here’s why: I think Janet Yellen might raise rates in September, regardless of the effects of a rate hike on the stock market.
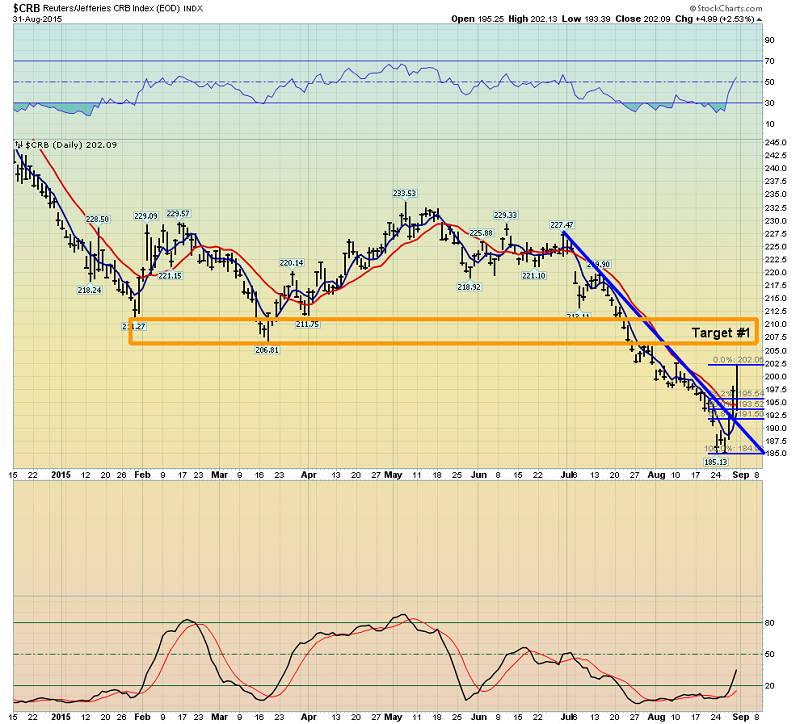
That’s the daily CRB chart, above. A huge rally in oil is helping to push commodity indexes sharply higher.
Stan Fischer is the latest Fed official to publicly state that the Fed needs to anticipate inflation, because it could arrive sooner than most investors realize.
I’ve suggested that rate hikes themselves are inflationary, because they make bank loans more profitable, and more loans can reverse the implosion in money supply velocity.
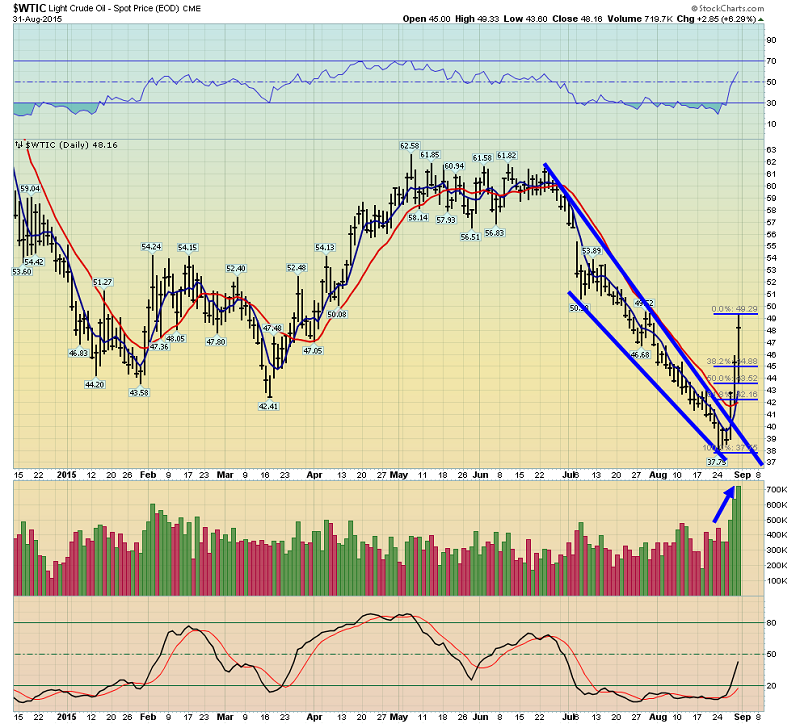
That’s the daily oil chart, above. I find it “interesting” that MSM (mainstream media) seems to enjoy referring to commodity “bear markets”, when the price declines by 20%. When the price rises 20% or more, as it just did for oil, MSM is strangely reluctant to use the term“bull market”.
Oil has just surged almost 30% higher. If the US stock market rallied 30%, MSM would be using foghorns to announce a new “bull market”. Using MSM’s own 20% yardstick, oil is now clearly in a bull market. Regardless, I’m much more interested in the huge volume that has accompanied the rally. That’s bullish.
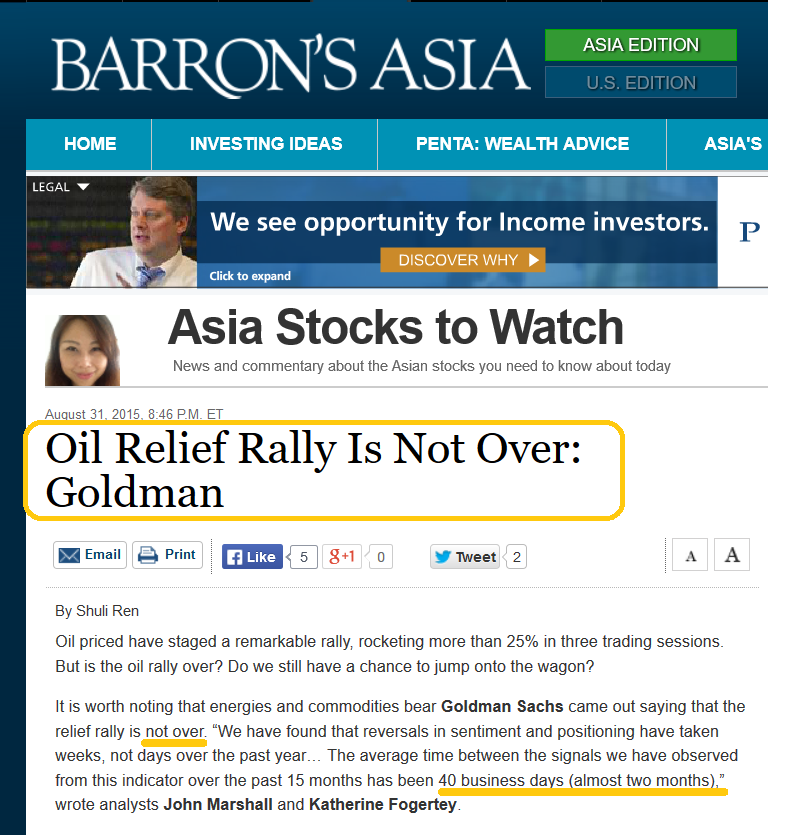
Also, I think the oil rally can continue, albeit after a sharp pullback, and I’m in very good company. Goldman Sachs analysts suggest that oil’s rally may only be just starting. They believe the rally could last for two months.
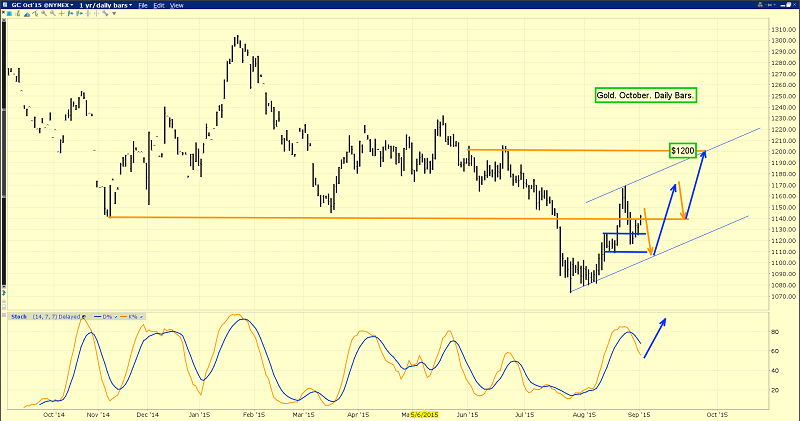
That’s the daily gold chart. Lower gold and CRB index prices are not music to the Fed’s ears. But I like the price action.
There might be a bit of a scary sell-off in the days ahead. That could take gold down to the low end of the $1110 - $1125 support zone, which I’ve highlighted on the chart. Here’s why:
The next US jobs report will be released on Friday at 8:30 AM. Gold has a rough general tendency to decline ahead of the jobs report, and then stage a nice rally. Here’s the good news:
After Friday’s report is released, I think gold should make its way to the $1200 area, without too much trouble.
I often refer to Indian gold jewellers and their clients as the world’s “titans of ton”. They have become pretty quiet after the violent $100 rally in the gold price, but I think they will be back on the buy-side in a big way,very soon.
What would happen if Janet raised rates in September? Well, in recent years, stock market swoons have been accompanied by a rush into T-bonds. It’s hard to know exactly how a rate hike would play out for gold, but one thing is clear: Seasonal gold buying in India is inelastic.
The average citizen in India couldn’t care less if the Dow and T-bonds are crashing.Their buying is based on religion. That’s why it’s inelastic. With their huge gold demand in play during gold’s strong season, and a potential rate hike from Janet, US stock market investors might sell bonds as well as stocks, and try to go to cash money. Cash money can take various forms. It can be fiat, or hard currency. Gold is traded as a currency at most major bank FOREX departments.
Alan Greenspan has warned that rate hikes could cause an “exit door event”. In that scenario bond market selling begets more bond market selling, and both the US dollar (fiat cash)and gold(hard money) become the main safe havens.
It’s important to remember that America’s top corporate directors took out full page advertisements just before the stock market crashed in 1929. They proclaimed a “bull era” of prosperity and permanently rising stock prices.
They really believed that their “bull era for stocks” would unfold. Instead, what transpired was the worst economic and stock market meltdown in the history of America. Investors in the Western gold community should be very wary about assuming that today’s bullish analysts are any smarter than their 1929 counterparts.
Also, if a gold community investor was very bearish on the Dow at the 2009 lows (I bought into those lows, and felt a lot of pain as I did), should they really be making wildly bullish US stock market statements now? The answer is of course: No.
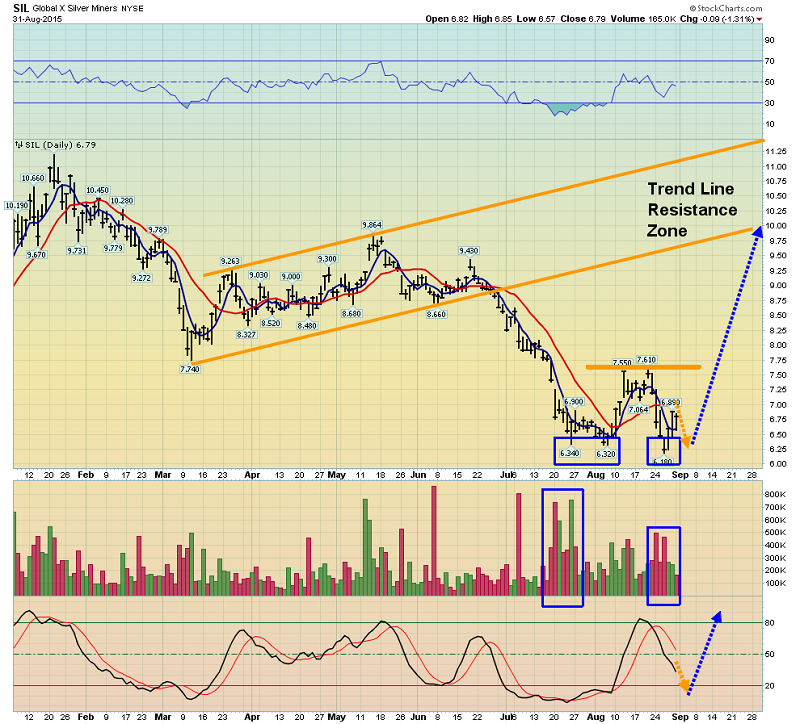
That’s the Global X Silver Miners ETF (NYSE:SIL) (silver stocks). Note the double bottom pattern in play. The left bottom is itself a small double bottom, and the same thing could happen with the right side.
Silver stocks, and silver itself, should dramatically outperform gold as US inflation approaches the 2% threshold level.
I think the rally that follows the jobs report, combined with Indian seasonal buying, could see SIL soar to trend line resistance in the $10 - $11.50 area! All minor weakness should be used to accumulate both gold and silver stocks before Friday’s jobs report is released. There’s no need to “back up the truck”, but there is a need to be a calm buyer now, to benefit from a potential rally of significant size!
Risks, Disclaimers, Legal: Stewart Thomson is no longer an investment advisor. The information provided by Stewart and Graceland Updates is for general information purposes only. Before taking any action on any investment, it is imperative that you consult with multiple properly licensed, experienced and qualified investment advisors and get numerous opinions before taking any action. Your minimum risk on any investment in the world is: 100% loss of all your money. You may be taking or preparing to take leveraged positions in investments and not know it, exposing yourself to unlimited risks. This is highly concerning if you are an investor in any derivatives products. There is an approx $700 trillion OTC Derivatives Iceberg with a tiny portion written off officially.
