
We have all heard about improved production per foot in current oil and gas unconventional wells. This improvement has been going on for a very long time, and started with completion styles that break up rock better close to the well bore. This is the reason we have seen a much slower decline in US oil production than most had estimated. This is why we only recently started to see the decline increase. It is possible oil will finally roll over, but this article calculates depletion in 2014. This has had a negative effect on oil prices, and the US Oil ETF (USO). The recent recovery has been well received, and we think $65/bbl WTI may still happen this year.
Our data shows the Permian isn’t the only area economic at today’s oil price. There are core areas in the Bakken, Eagle Ford, Powder River Basin, and Niobrara. Due to core areas’ ability to produce with lower realized oil prices needed to complete wells, defaults may need to occur for a decrease. Operators with no core acreage will have issues. Even with optimal design, lower pressured areas do not produce well enough. Those with high debt payments will have further issues. Now that much of the hedge protection is gone, operators will show the economics of its best leasehold.
Well design improvements have improved well economics immensely. Over the past two years, most operators have used a standard well design. These are 9,000-foot, 30-stage laterals. Three million pounds of proppant and 50,000 bbls of fluids went down hole. Operators are now doing huge frac jobs that are 50+ stages, 6+ million pounds of sand and 100,000 bbls of frac fluids. Some jobs are much bigger and may have more production than initially estimated. Operators are finding, through well communication, adjacent wells increase production. Sand-heavy fracs are increasing production faster than expected. This design costs more, so it is generally used in the sweet spot of each play. Well production from core areas can out produce marginal areas up to 500%. On average, this is closer to 300%, but depends on the areas used for comparison. Operators drill less and make more, but now it’s the only option.
The question focused on associated production is: How is it occurring? Two wells can be placed fairly close depending on the geology. Thicker shale means more wells can be drilled/section. Some plays allow for tighter spacing, as long as resource sharing does not hurt well economics. Not only do we see production from the completed well, but others near it. This has been a positive effect on new production. One well will start producing, and we see a jump in production from other wells in communication. I do not believe operators were trying to do this, but a very high pressure frac job seems to be working its way into adjacent wells.
Well communication is when fractures in the shale from one frac come into contact with another producing location. Early in development, operators did not want wells to communicate for fear it could depressurize the locations and slow or stop production. This hasn’t been the case, and communication may have advantages. If wells share fracture systems, it means they produce together. Each well can be affected if a change is made to the fracture system. We saw this with EOG’s (NYSE:EOG) water floods in Parshall field. It used this to stimulate production from one well, but found production increased in all wells on the pad. The water flood affected all wells sharing the fracture systems. This is also occurring with sand-heavy fracs done by several operators working in the Bakken. The pressure from a new Mega-frac is increasing production in all wells in contact with it.
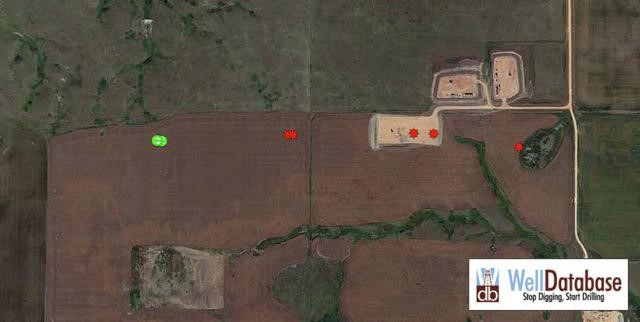
Continental Resources (NYSE:CLR) recently completed Salers Federal 3-27H. This sand-heavy frac was a 50-stage-long lateral. It utilized 312,000 bbls of frac fluids and 18 million lbs of sand plus 1.2 million pounds of ceramic proppant. In total, it used just shy of 20 million pounds of proppant. This was an excellent well. The geology is very good and well design top notch. The map below provides the location of the pad it was drilled on. Of the seven wells on the Salers Federal pad, only three are producing.
Click to enlarge
![]() (Source: Welldatabase.com)
(Source: Welldatabase.com)
The four non-producing wells are part of Continental’s fraclog. Salers Federal 3-27H is the furthest well to the east on the map above.
| Date | Oil (bbl) | Gas (Mcf) | BOE |
| 9/1/2014 | 8,595.00 | 4,052.00 | 4052 |
| 10/1/2014 | 32,388.00 | 43,189.00 | 43189 |
| 11/1/2014 | 21,984.00 | 26,667.00 | 26667 |
| 12/1/2014 | 20,970.00 | 24,696.00 | 24696 |
| 1/1/2015 | 16,420.00 | 20,089.00 | 20089 |
| 2/1/2015 | 16,487.00 | 19,388.00 | 19388 |
| 3/1/2015 | 16,746.00 | 21,099.00 | 21099 |
| 4/1/2015 | 14,191.00 | 16,719.00 | 16719 |
| 5/1/2015 | 25,164.00 | 31,924.00 | 31924 |
(Source: Welldatabase.com)
In nine months, it produced over $11 million in revenues using $60/bbl oil and $3/Mcf. It produced 172,950 Bo and 207,820 Mcf. The combination of sweet spot geology and top-notch well design has produced excellent production numbers. Although Salers Federal 3-27H produced very well, it stimulated production elsewhere.
Salers 1-27H was completed in May of last year. This was four months before Salers Federal 3-27H. It was a 30-stage frac using 92,000 bbls of fluids and 5.9 million pounds of proppant. Production from this well was lower over the first nine months. When Salers Federal 3-27H was completed, it increased production from 1-27H.
| Date | Oil | Gas | BOE |
| 4/1/2014 | 0 | 0 | 0 |
| 5/1/2014 | 11,549.00 | 10,917.00 | 10917 |
| 6/1/2014 | 25,058.00 | 29,586.00 | 29586 |
| 7/1/2014 | 19,731.00 | 21,065.00 | 21065 |
| 8/1/2014 | 15,814.00 | 17,618.00 | 17618 |
| 9/1/2014 | 12,416.00 | 14,329.00 | 14329 |
| 10/1/2014 | 22,182.00 | 27,891.00 | 27891 |
| 11/1/2014 | 19,782.00 | 23,113.00 | 23113 |
| 12/1/2014 | 9,659.00 | 11,085.00 | 11085 |
| 1/1/2015 | 15,953.00 | 18,952.00 | 18952 |
| 2/1/2015 | 16,953.00 | 20,151.00 | 20151 |
| 3/1/2015 | 21,168.00 | 26,635.00 | 26635 |
| 4/1/2015 | 21,025.00 | 27,322.00 | 27322 |
| 5/1/2015 | 19,628.00 | 26,571.00 | 26571 |
(Source: Welldatabase.com)
In nine months, excluding the first non-productive month, it produced 20,000 bbls of crude and 33,000 Mcf less. 3-27H produced $1.3 million more in revenues in just the first nine months.
Click to enlarge
![]() (Source: NDIC)
(Source: NDIC)
One very important month to watch was October 2014. Looking at 1-27H, it saw a significant uptick in production. This move to 22,000 Bo from 12,000 Bo the month before was during the first month of full production from 3-27H. More importantly, there is little to no depletion. This well produced for a full year and is still producing almost 20,000 bbls of crude. This compares to the first full month of production at 25,000 bbls of crude. This is important because of well communication. 3-27H was a high-pressure frac using large amounts of sand and water. It is possible 3-27H not only increased production through communication, but also may have been a test to increase production from 1-27H. Operators may be doing these fracs to force proppant into the fracs created, but also into the fractures of adjacent wells. Essentially, it may be re-fracking portions of the wells next to it.
Salers 2-27H is the other producing well next to 3-27H. It is different from 1-27H in that it targeted the Three Forks. This well was added due to its pay zone. We know there is associated production stimulated from middle Bakken producers, but this location seems to point to communication across source rock.
| Date | Oil | Gas | BOE | Water |
| 5/1/2014 | 4,054.00 | 2,977.00 | 2977 | 11,204.00 |
| 6/1/2014 | 29,243.00 | 34,815.00 | 34815 | 6,916.00 |
| 7/1/2014 | 21,355.00 | 24,194.00 | 24194 | 3,880.00 |
| 8/1/2014 | 15,515.00 | 16,849.00 | 16849 | 2,835.00 |
| 9/1/2014 | 8,529.00 | 9,787.00 | 9787 | 8,105.00 |
| 10/1/2014 | 32,333.00 | 42,520.00 | 42520 | 17,801.00 |
| 11/1/2014 | 20,322.00 | 25,508.00 | 25508 | 5,572.00 |
| 12/1/2014 | 12,921.00 | 13,690.00 | 13690 | 3,523.00 |
| 1/1/2015 | 12,575.00 | 14,413.00 | 14413 | 2,855.00 |
| 2/1/2015 | 15,771.00 | 19,437.00 | 19437 | 2,888.00 |
| 3/1/2015 | 14,082.00 | 17,027.00 | 17027 | 2,650.00 |
| 4/1/2015 | 14,133.00 | 15,632.00 | 15632 | 2,457.00 |
| 5/1/2015 | 19,108.00 | 23,068.00 | 23068 | 3,890.00 |
(Source: Welldatabase.com)
The associated production was not as great long term, but we saw a very large move upward initially. The month of October 2014 had production of 32,000 bbls of crude. This is significant as it was the best performing month to date for both crude and natural gas. Production then slumped but saw an uptick in May to 19,000 bbls.
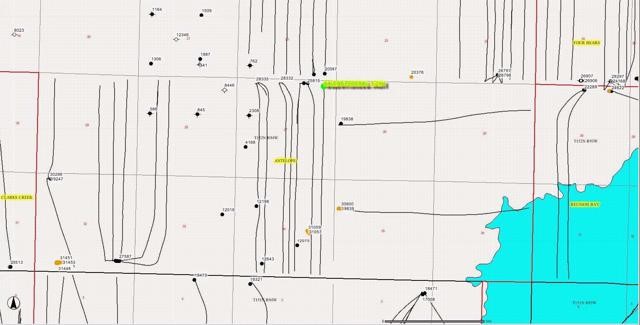
QEP Resources (NYSE:QEP) in Grail Field has had similar results. QEP purchased its Grail Field leasehold from Helis Oil & Gas a few years ago. This is a very good area, and at the time of the purchase may have been one of the more sought after leaseholds in the Bakken. QEP recently increased its fluids and proppant usage significantly, and we are starting to see associated well production from adjacent wells. The wells in focus are from the Moberg pad. Keep in mind, QEP recently started to improve its well design. This includes additional stages, proppant and fluids.
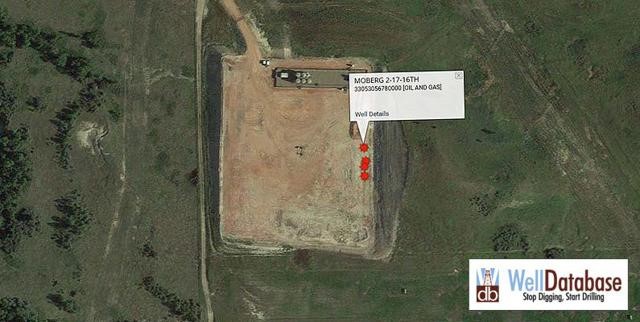
All of this should improve shale fracturing. When source rock is fracked, pressures are released. This is a combination of the weight of the geology and resource. So the more fractures created the more pressure is released throughout the system. It is imperative to understand newer well designs release more pressure which will be exerted on wells in communication. Operators that do a better job of isolating fractures will see less pressure to other wells, but the closer well spacing gets, the more difficult this will be to control. There are several Moberg pads in Grail Field, but the data pulled centers around Moberg 13-17/16H. This well saw a significant uptick in production when three wells were completed on the same pad.
Click to enlarge
![]() (Source: Welldatabase.com)
(Source: Welldatabase.com)
Moberg 2-17-16TH started producing in July 2014. It is an upper Three Forks well.
| Date | Oil | Gas | BOE | Water |
| 7/1/2014 | 15,528.00 | 372 | 372 | 7,700.00 |
| 8/1/2014 | 33,491.00 | 14,885.00 | 14885 | 11,073.00 |
| 9/1/2014 | 26,668.00 | 8,214.00 | 8214 | 7,610.00 |
| 10/1/2014 | 28,418.00 | 49,279.00 | 49279 | 8,794.00 |
| 11/1/2014 | 21,716.00 | 40,390.00 | 40390 | 6,605.00 |
| 12/1/2014 | 22,562.00 | 41,577.00 | 41577 | 4,972.00 |
| 1/1/2015 | 15,926.00 | 34,711.00 | 34711 | 5,728.00 |
(Source: Welldatabase.com)
It is important to note that Moberg 2-17-16TH is not QEP’s newest well design. This is still an excellent well, but QEP now has increased stages, proppant and fluids. The newest generation should produce better, and increase well pressures. Well depletion is minor at seven months of production. This is a usual occurrence as pressures stay high longer. 2-17-16TH is a 32-stage completion used 107,000 bbls of water and 8.3 million pounds of proppant.
The second well is Moberg 3-17-16BH. It underperformed the other wells, but was the middle well of the three. As a general rule, this position doesn’t produce as well, due to resource sharing. It is possible there were problems in completion, but we do not know this for sure. It is a middle Bakken well.
| Date | Oil | Gas | BOE | Water |
| 7/1/2014 | 6,737.00 | 161 | 161 | 2,729.00 |
| 8/1/2014 | 20,518.00 | 11,821.00 | 11821 | 5,046.00 |
| 9/1/2014 | 18,652.00 | 5,286.00 | 5286 | 4,546.00 |
| 10/1/2014 | 18,494.00 | 34,653.00 | 34653 | 5,539.00 |
| 11/1/2014 | 9,268.00 | 22,977.00 | 22977 | 2,807.00 |
| 12/1/2014 | 9,220.00 | 15,423.00 | 15423 | 2,102.00 |
| 1/1/2015 | 8,502.00 | 10,275.00 | 10275 | 2,407.00 |
(Source: Welldatabase.com)
This is a 32-stage frac using 107,000 bbls of water and 8.3 million pounds of proppant. The final well in this pad (and the well furthest south) is Moberg 4-17-16BH. It is a middle Bakken producer.
| Date | Oil | Gas | BOE | Water |
| 7/1/2014 | 3,181.00 | 76 | 76 | 1,805.00 |
| 8/1/2014 | 22,983.00 | 9,501.00 | 9501 | 9,925.00 |
| 9/1/2014 | 28,579.00 | 7,051.00 | 7051 | 12,467.00 |
| 10/1/2014 | 36,153.00 | 55,510.00 | 55510 | 8,138.00 |
| 11/1/2014 | 19,362.00 | 32,643.00 | 32643 | 4,494.00 |
| 12/1/2014 | 19,338.00 | 31,019.00 | 31019 | 10,150.00 |
| 1/1/2015 | 21,241.00 | 27,188.00 | 27188 | 5,399.00 |
(Source: Welldatabase.com)
The well design includes 32 stages and 110,000 bbls of water. 8.4 million pounds of sand is part of this design. It is another very good result. After production peaked in October, the well has maintained production for three months.
Click to enlarge
![]() (Source: NDIC)
(Source: NDIC)
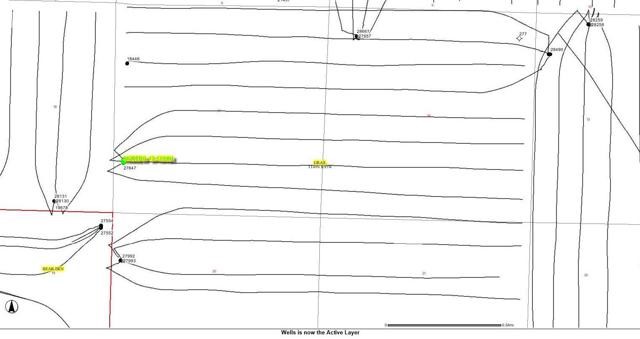
Moberg 13-17/16H was the first well on this pad. While the others started producing in July 2014, it was completed in February 2013. This Three Forks well is a 30-stage frac using 46,000 bbls of water and 3 million pounds of proppant. Because the well has an inferior design, it depleted faster than the three newer wells on the pad. In March 2014, Moberg 3-17/16H was shut in for four months as the other wells were completed. In July 2014, it started producing again for just a few days. In the month of August, there was a significant increase in production. It began to produce more like it did in the beginning of well life. From September 2013 to February 2014, it only produced about 10,000 bbls/mo. of crude. It produced well above that for six months after the three well pad was completed.
| Date | Oil | Gas | BOE | Water |
| 2/1/2013 | 21,657.00 | 8,317.00 | 8317 | 11,212.00 |
| 3/1/2013 | 25,866.00 | 33,941.00 | 33941 | 7,256.00 |
| 4/1/2013 | 20,143.00 | 24,270.00 | 24270 | 5,374.00 |
| 5/1/2013 | 21,552.00 | 23,558.00 | 23558 | 5,098.00 |
| 6/1/2013 | 19,810.00 | 24,089.00 | 24089 | 4,646.00 |
| 7/1/2013 | 17,086.00 | 20,005.00 | 20005 | 3,797.00 |
| 8/1/2013 | 16,876.00 | 33,333.00 | 33333 | 4,378.00 |
| 9/1/2013 | 7,922.00 | 9,995.00 | 9995 | 2,162.00 |
| 10/1/2013 | 9,581.00 | 4,937.00 | 4937 | 3,198.00 |
| 11/1/2013 | 10,797.00 | 9,800.00 | 9800 | 3,275.00 |
| 12/1/2013 | 9,396.00 | 11,380.00 | 11380 | 2,400.00 |
| 1/1/2014 | 9,646.00 | 14,339.00 | 14339 | 2,602.00 |
| 2/1/2014 | 3,136.00 | 4,614.00 | 4614 | 858 |
| 3/1/2014 | 0 | 0 | 0 | 0 |
| 4/1/2014 | 0 | 0 | 0 | 0 |
| 5/1/2014 | 0 | 0 | 0 | 0 |
| 6/1/2014 | 0 | 0 | 0 | 0 |
| 7/1/2014 | 1,802.00 | 43 | 43 | 1,331.00 |
| 8/1/2014 | 18,812.00 | 7,431.00 | 7431 | 9,933.00 |
| 9/1/2014 | 21,811.00 | 5,830.00 | 5830 | 10,119.00 |
| 10/1/2014 | 16,145.00 | 19,704.00 | 19704 | 5,586.00 |
| 11/1/2014 | 11,144.00 | 15,731.00 | 15731 | 3,721.00 |
| 12/1/2014 | 13,197.00 | 20,626.00 | 20626 | 3,829.00 |
| 1/1/2015 | 15,639.00 | 21,587.00 | 21587 | 5,283.00 |
(Source: Welldatabase.com)
Does this mean the well was partially re-fracked, or are these additional well pressures from the other three wells working resource to the well-bore? We do not know for sure. It is possible this well is just seeing a marked increase of production. It may not mean the well will produce any more resource over its well life, which would mean EURs are roughly the same. Either way, production is garnered faster, and that means increased revenues in the short term.
Increased well production from adjacent wells continues to occur. The amount of resource varies significantly, but high-intensity sand fracs are by far more effective. Throughout Parshall field, there are a large number of wells that are seeing this, but to a lesser degree. Wells completed in 2008 that are producing just 3,000 bbls/month see production double using lesser well designs. It occurs throughout the entire play, and is not currently accounted for in production estimates. Some operators do a very good job of keeping wells apart, because well communication can cause negative results. Now that oil prices are lower, operators are forced to drill more wells at tighter spacing in core areas. This coupled with well designs that increase pressures may be driving production.
Due to confidential well status, we are always a step behind the operators with respect to production increases. It is possible horizontal well production can compete at $60/bbl oil or lower. There are significant risks to increasing production from adjacent wells. If an operator were to drill too close to another well for the purpose of fracking into a well nearby, it could ruin the reservoir. This could significantly decrease or stop production from all wells affected. The hope is to increase the estimated reserves of the well by re-opening fracs that have closed or opening new fissures.
In summary, it is possible that operators are stimulating significant production from adjacent wells during completions. There are several other ETFs that focus on U.S. and world crude prices:
· iPath S&P Crude Oil Total Return Index ETN (NYSEARCA:OIL)
· ProShares Ultra Bloomberg Crude Oil ETF (NYSEARCA:UCO)
· VelocityShares 3x Long Crude Oil ETN (NYSEARCA:UWTI)
· ProShares Ultrashort Bloomberg Crude Oil ETF (NYSEARCA:SCO)
· U.S. Brent Oil ETF (NYSEARCA:BNO)
· PowerShares DB Oil ETF (NYSEARCA:DBO)
· VelocityShares 3x Inverse Crude Oil ETN (NYSEARCA:DWTI)
· PowerShares DB Crude Oil Double Short ETN (NYSEARCA:DTO)
· U.S. 12 Month Oil ETF (NYSEARCA:USL)
· U.S. Short Oil ETF (NYSEARCA:DNO)
· PowerShares DB Crude Oil Long ETN (NYSEARCA:OLO)
· PowerShares DB Crude Oil Short ETN (NYSEARCA:SZO)
· iPath Pure Beta Crude Oil ETN (NYSEARCA:OLEM)
The newest hybrid styles produce much better fracturing of shale than older designs. The combination of large volumes of sand and water, coupled with mega-fracs, produces the best results and increases production at nearby locations. This is an educated guess on our part, but other wells may be re-fracked in some stages. By stimulating a well next to that completion, it is possible other well(s) are fracked with it. Some of the large volumes of sand may end up in other wells. This may also reopen closed fractures and allow proppant to be reset. It could connect adjacent wells with other induced or natural fracture systems.
There is a downside to attempting this. Well communication and over-stimulation can actually damage the shale and producing qualities of the wells around it. Initially, operators probably weren’t trying to do this, but were pleased with adjacent well production from mega-fracs. Operators may be trying to consistently accomplish this without negative effects. This is a difficult idea, as the operator would have to do a good job of controlling the frac. Mega-fracs may be a major reason U.S. production is maintaining at current levels. When combined with high grading, operators will produce significantly more per completion. If an operator declines to drill a well in Burke County and in turn completes in Grail Field, the production could be 300% or 400% better. Associated production is not figured in.
If operators are seeing a 70% increase in production from mega-fracs, this production adds significantly more. It is not an isolated situation. Operators are doing this in the Bakken, Eagle Ford, Powder River Basin, etc. Many operators are deploying these designs – QEP Resources, Continental, EOG, Matador (NYSE:MTDR), just to name a few. Mega-fracs continue to improve every day. We are just starting to see operators implement the design EOG Resources has been using for years. As operators use more mega-fracs, production per foot will continue to grow. This is one of the fundamental reasons U.S. production is able to maintain levels in the face of lower completion numbers.
toolpush on Sun, 3rd Jul 2016 6:21 am
Hey Coffee,
Did you write this?
Coffeeguyzz on Sun, 3rd Jul 2016 7:28 am
Push
LOL!
Seriously, although the dateline on this article is today, July 3, 2016, Filloon first published this on Seeking Alpha last summer, I believe.
More relevantly, Push, and to the point of this article, I finally got around to getting that ND DMR subscription (HIGHLY recommended – for 50 bucks – as well as a bigger-screened tablet to more easily see the well placements in the Bakken.
Wow. Just, wow.
100% of the 30 or so wells I have now quickly accessed production records on as well as precisely located on the Gis map show uptick in production (as well as produced water) when new, nearby wells are frac’d and brought online.
A doubling or quadrupling of output is not uncommon … some cases show a tenfold increase.
The effects taper off after 8 months or so, only to repeat if another well, nearby, is frac’d.
Fascinating stuff.
penury on Sun, 3rd Jul 2016 9:56 am
So currently we are celebrating the ability to use a finite resource at a faster rate. I wonder what comes next after fossil fuels? (and electricity is not the answer). And will any portion of the world be able to produce and utilize these resources?
rockman on Mon, 4th Jul 2016 12:12 pm
“This is the reason we have seen a much slower decline in US oil production than most had estimated.” And we have also seen a much higher decline rate “then most had estimated”: according to the EIA production has fallen by 6.5% since the first of the year.
Great news for Continental and the other mega-fracers. For the rest country not quite as great since those great wells are a very tiny minority of the 600,000+ US producing oil wells. Which is why the average US well (including all the shale wells) is still less then 20 bopd.
The Continental wells are no more representative of the currernt shale plays then the equal number of recent long laterals with numerous frac stages that won’t produce but a small fraction of the Contenental wells.
99.9% of the American public doesn’t care how any shale player is doing. Or even how the entire US oil patch is doing. All they care about is the availability and price of refinery products. And as total production from the shale plays CONTINUES TO DECLINE those factors will become more critical for consumers.
Northwest Resident on Mon, 4th Jul 2016 12:36 pm
“And as total production from the shale plays CONTINUES TO DECLINE…”
Declines, indeed. Also rapidly declining investment in new development which WILL lead to significantly decreased supply. Or, as Art Berman puts it:
“What’s happening right now that (at least according to the International Energy Agency) has never happened before is that we had two consecutive years where investment in oil production, infrastructure, exploration is significantly lower than the year before. And we may be going on a third year.”
Also: “Conventional oil is declining: it’s in terminal decline. Nobody is investing in conventional oil projects that move the needle in terms of global supply. Not reserves that really matter. All of the investment that is going on today is in expensive oil.”
Great interview of Art Berman here:
http://www.peakprosperity.com/podcast/99333/art-berman-coming-moonshot-oil-prices
rockman on Mon, 4th Jul 2016 11:37 pm
NR – Amazing isn’t it how some folks argue that oil production isn’t declining and yet can’t post any DOCUMENTED data to support their claim?