Today we’d like to point out one of the U.S. Stock market indices that looks appears to be topping: The Russell 2000 (RUT). And we’d like to focus on the iShares Russell 2000 ETF (IWM) for this exercise.
But before we share why we think the Russell 2000 ETF (IWM) is topping, let’s review what goes into a market topping process.
One thing traders can expect reliably from topping events in stock indices is that they will be complicated. In that respect they are unlike the majority of landmark lows, which can present beautifully simple ending signals to the bullish trader who is prepared to notice them. Important price lows often arrive when the market is in its most panicked state. In contrast, landmark highs are characterized not by panic but by frustration.
At the highs, the market toys with bullish and bearish participants alike, shaking out the least prepared traders even while it sets traps to draw the them back in to make another false move. After it has become clear that equities have reached significant resistance and are unable to score further advances, the market still can spend weeks or months offering tantalizing signals to both sides, to be followed by rapid and often heartbreaking reversals.
We believe that is where U.S. and European stock market indices are now – in the midst of a complex topping event has been characterized by many false starts and by frustration on all sides. As is typical in these circumstances, there has been substantial intermarket divergence, with some indices making new highs in recent weeks while others appear poised to fall from lower highs.
And this is where the Russell 2000 ETF (IWM) comes into play. We believe that it is one of the best candidates to put in a lower high. The heavily watched portfolio of small-cap stocks that has been among the leaders in the advance from 2009 now may be among the indices that has the farthest to fall. Here we present a close-up study of the chart pattern that makes the Russell one of the best candidates for having a completed topping pattern. Note that we highlighted weakness in the Russell 2000 back in late March.
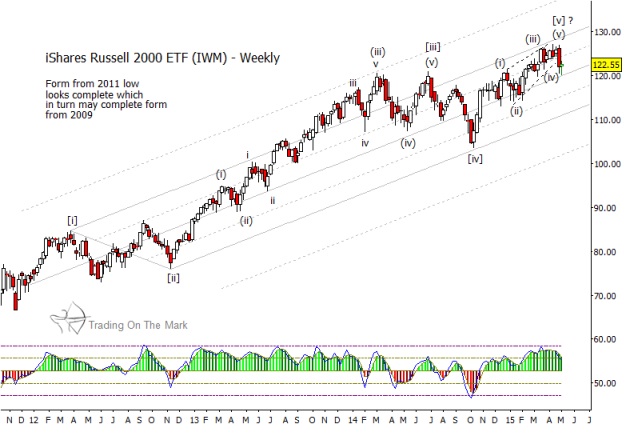
The weekly chart below shows the iShares Russell 2000 ETF (IWM) at a time when the advance appears to be faltering and when the Elliott wave pattern meets the criteria for possible completion. As context, we believe IWM and certain other indices have formed a large three-wave upward correction since their lows in 2008 and 2009. With IWM, the third or C wave of that formation began in 2011 and should consist of five sub-waves. When finished, it should be followed either by a substantial correction or a major reversal.
On a weekly time frame, the first confirmation of a sizeable decline in IWM probably will be a weekly close beneath the center line of the channel that has contained the advance since 2012. After that confirmation, the first downward target on the weekly chart probably will be the lower (solid) channel boundary. Following that, a break of the lower boundary may lead to a test of the lower (dashed) harmonic channel line and perhaps to even lower targets.
iShares Russell 2000 ETF (IWM) – Weekly Chart
We emphasize that it is not a certainty that equity indices are ready to fall this month. In fact, as of this writing we believe odds favor a scenario in which the S&P 500 Index reaches a marginally higher high in coming days. However, with typical intermarket divergence, some indices probably will form lower highs even as others make higher ones. On a time frame faster than weekly bars, IWM is probably the best candidate to form a lower high soon.
Specifically, the pattern in IWM after the October 2014 low was charting well as an ending diagonal – a terminal pattern – until the general market high of April 27. On that day several U.S. indices formed new highs, including the NASDAQ 100, the S&P 500 and the S&P 100. While those indices were making records, IWM faltered in a potentially important way. In what might be an example of a truncated pattern, IWM formed a slightly lower high compared to what it accomplished eight days earlier. This could be the inconsistency – the “glitch in the matrix” – that leads the watchful trader to consider that the prospect of continued advances in equities might be an illusion. A diagonal pattern reflects changing sentiment, and the failure of IWM even to complete its diagonal represents a fairly bearish signal.
iShares Russell 2000 ETF (IWM) – Daily Chart
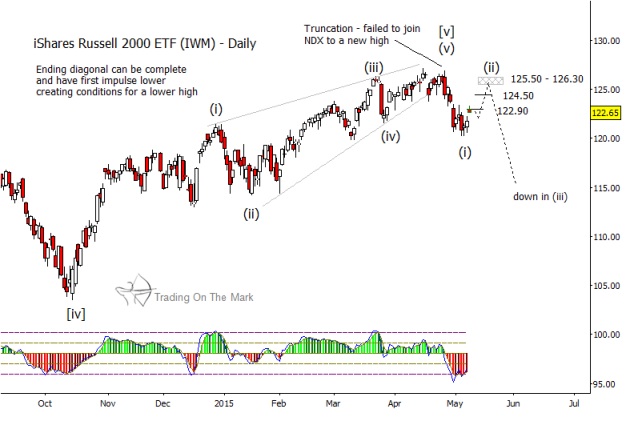
The market decline and rebound after April 27 left unclear patterns in several indices, but IWM has been the weakest among the indices in its ability to climb up from the very recent low. If the top truly is in for IWM, then price should behave as though it forming an upward retracement this week. In particular, it should recognize and find resistance at the standard Fibonacci retracement values we have marked on the daily chart above. Watching those levels closely, a trader may find evidence either to support or discount the idea that the IWM high is in.
You can find charts and analysis of several U.S. stock market indices, as well as treasury bonds in our latest eBook, available later this week through our website Trading On The Mark and at Amazon. The publication shows current price targets and highlights signals to watch that would confirm the next trend change and window for trade entry.
Follow Tom & Kurt on Twitter: @TradingOnMark
No position in any of the mentioned securities at the time of publication. Any opinions expressed herein are solely those of the author, and do not in any way represent the views or opinions of any other person or entity.

 Rolling Over At Key Fibonacci Level?")


