Sell – Signal generated on the close of October 12
(click here for more details)
today’s watchlist (potential trade entries):

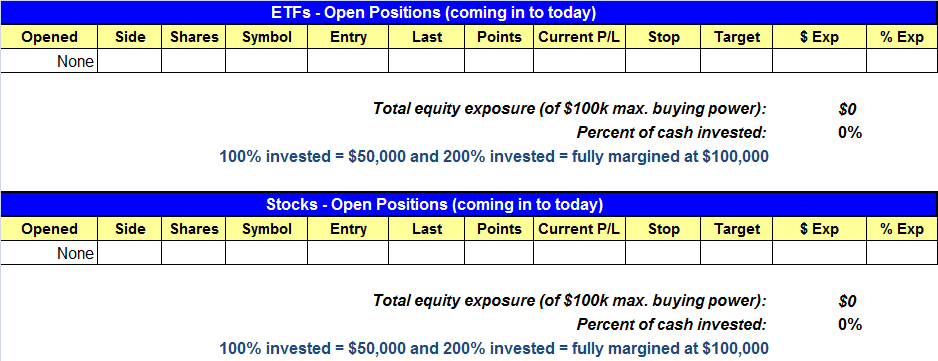
Having trouble seeing the open positions graphic above? Click here to view it directly on your web browser instead.
Below is an overview of all open positions, as well as a report on all positions that were closed only since the previous day’s newsletter. Net P/L figures are based on two separate $50,000 model portfolios (one for ETFs and one for stocks). Changes to open positions since the previous report are listed in pink shaded cells below. Be sure to read the Wagner Daily subscriber guide for important, automatic rules on trade entries and exits.
Having trouble seeing the open positions graphic above? Click here to view it directly on your web browser instead.
closed positions:

Having trouble seeing the closed positions graphic above?
Click here to view it directly on your web browser instead.
ETF position notes:
- The EEV setups did not trigger on Wednesday and has been removed from the watchlist.
- There are two new setups on today’s watchlist. IBB is a sell stop order, meaning we will only enter if the price trades below the specified trigger price. Conversely, SMN is a buy stop order, so we will only buy if the price trades above the listed trigger price.
stock position notes:
- No trades were made.
ETF and broad market commentary:
Stocks headed into the Thanksgiving Day holiday with a calm, stable session of trading on Wednesday. Building on the gains of the market’s recent bounce off the lows, the main stock market indexes each advanced an average of approximately 0.35%. As is typically the case ahead of holidays, turnover receded across the board. Average volume in the NYSE and Nasdaq was about 15% lighter than the previous day’s levels.
Today, the US stock market will close early, at 1:00 PM EST. As previously mentioned, today’s newsletter is accordingly an abbreviated version, just to update you on our positions. The EEV setup from Wednesday did not hit our trigger price for entry, and has been removed from our watchlist and replaced with two additional setups instead. Going into today’s shortened session, we are stalking iShares Nasdaq Biotechnology Index ETF ($IBB) for potential short entry and ProShares UltraShort Basic Materials ETF ($SMN) for possible buy entry. See the ETF Watchlist above for trade details. We have pointed out both of these setups as potential swing trade entries in recent days, and will provide updated chart analysis of these setups in Monday’s newsletter.
The market is just one strong accumulation day away from generating a new “buy” signal in our market timing model. The model was designed to prevent us from fighting against the tape and making emotional decisions. To accomplish this, there is a mechanical (systematic) aspect to the timing model that is satisfied when a market:
- Holds on to a swing low for at least a few days (can not be setting new “swing lows”)
- Prints multiple accumulation days with no distribution
- Prints a “confirmation day,” which is a big advance (1.5% or more) on heavy volume
When the criteria above is satisfied, the market timing model will shift into “buy” mode. However, we have noticed at times over the years that a market can be manipulated to look a certain way for a few days to lure in the bulls. Because of this, not all buy signals are created equal. This is where the discretionary side of our trading system comes in to play, as we attempt to gauge the strength of the rally and limit the damage in the event of a false buy signal. On the discretionary side, it is our job to identify the following: Where are the leading stocks and how are they acting? Are new setups breaking out and do our nightly scans look promising? We also have a few proprietary indicators that we use to confirm our research. For us, a true market bottom is never a one-day event, as we need a few weeks to assess the strength of the rally.
As the market timing system still remains in “sell” mode, our plan over the coming week is to monitor for potential short selling setups with low-risk entry points…if they develop. We must also keep an eye on top the relative strength stocks in case the market begins to show signs of life.
If you are a new subscriber, please e-mail [email protected] with any questions regarding our trading strategy, money management, or how to make the most out of this report.
relative strength combo watchlist:
Our Relative Strength Combo Watchlist makes it easy for subscribers to import data into their own scanning software, such as Tradestation, Interactive Brokers, and TC2000. This list is comprised of the strongest stocks (technically and fundamentally) in the market over the past six to 12 months. The scan is updated every Sunday, and this week’s RS Combo Watchlist can be downloaded by logging in to the Members Area of our web site.