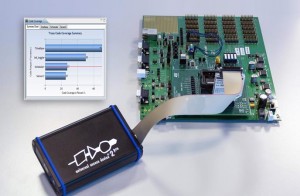
The Universal Debug Engine (UDE) 4.4.6 will implement programming of the MCU’s integrated flash memory as well as the control and management of the CPUs and modules.
As a result main cores can be selected as debug targets, but also the MCUs timer and hardware security module or indeed the whole device.
The SPC58 E-line MCUs integrate three CPU cores based on the Power Architecture with 6320kbyte on-chip flash memory and 768kbyte SRAM.
With up to seven Controller Area Network (CAN) nodes and one Time-Triggered Controller Area Network (TTCAN) node, the MCUs are expected to be used in engine management, transmission control and advanced driver assistance systems (ADAS).
Management of the individual active units by the debugger is carried out via a multi-core run control manager, which enables an almost synchronous starting and stopping of the various cores using logic that is integrated on the chip.
Multi-core breakpoints are implemented in the UDE and as a result when running shared code a simultaneously acting breakpoint for all cores can be set. Data breakpoints in turn allow the recognition of read and/or write accesses to a variable.
For configuring the MCU’s several hundred registers of the additional emulation memory, PLS offers the Universal Emulation Configurator (UEC) with block graphics user interface in addition to the UDE 4.4.6.
“The Universal Emulation Configurator (UEC) helps the user to cope as effectively as possible with the limited resources of the on-chip emulation memory. In parallel to this, the implemented Aurora interface offers the possibility to externally record a very large amount of trace data and to carry out a statistical analysis of the program flow such as code coverage and profiling,” said PLS.
PLS’ Universal Access Device 3+ (UAD3+) with Aurora pod serves for recording, while the evaluation itself is carried out by the Universal Debug Engine (UDE).
 Electronics Weekly Electronics Design & Components Tech News


