- Gold has a relook at double top neckline, could be crowding out weak bears.
- The long-term outlook remains bearish.
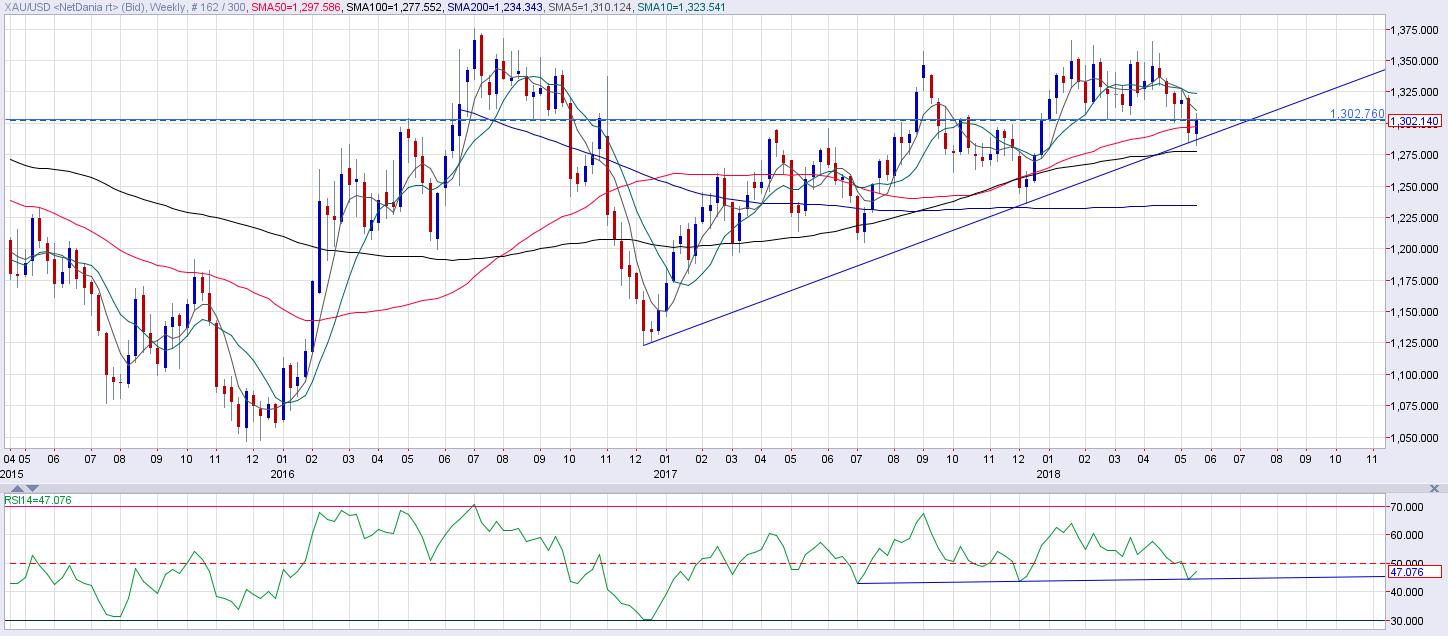
Gold defended a key rising trendline support and revisited the double top neckline level of $1,302 this week as expected,
Currently, the yellow metal is trading at $1,303, having clocked a weekly high and low of $1,307.80 and $1,282.01, respectively. The recovery from $1,282 is encouraging, still, it is too early to call a bullish trend reversal.
Downside still calling
Weekly chart

The chart shows the corrective rally seems to have run out of steam around the double top neckline level of $1,302. Moreover, this could be a bull trap as markets tend to crowd out weak hands (bears in gold's case) following a major bearish (or bullish) breakdown. So, gold may have shaken out weak bears this week by having a re-look at levels above the neckline and could resume the sell-off next week.
The descending 5-week and 10-week moving averages (MAs) continue to favor the bears. Further, the corrective rally from the weekly low of $1,302 has failed to cut through $1,308.6 - 23.6 percent Fibonacci retracement of Dec 2016 - Jan 2018 rally.
Also, the metal is trapped inside a falling channel, as seen in the chart below.
Daily chart
-636628733759391348.png)
Short-term view (next week)
The metal will likely revisit $1,282. The bear case will strengthen if gold bulls are unable to penetrate the falling channel hurdle on Monday and Tuesday. Meanwhile, a bullish falling channel breakout would shift risk in favor of a rally to $1,315-$1,320.
Bearish invalidation: A daily close above the 200-day MA located at $1,308 would abort the bearish view.
Bullish reversal: A close above $1,325 would confirm a short-term bear-to-bull trend change and would allow re-test of the all-important resistance of 100-month MA, currently located at $1,352.
Long-term view: Gold could drop to $1,240
Monthly chart
The repeated failure to beat the 100-month MA in a convincing manner, despite the large bullish RSI divergence (from mid-2013 to end 2015) could have weakened the bulls. This, coupled with the double top reversal (seen in the weekly chart), indicates the metal will likely drop to $1,240 (double top neckline target) - $1,236 (50-month MA) in the next couple of months.
Only a monthly close above the 100-month MA, currently seen at $$1,352, would signal a resumption of the rally from the December 2015 low of $1,046 and would open up upside towards $1,500.
Information on these pages contains forward-looking statements that involve risks and uncertainties. Markets and instruments profiled on this page are for informational purposes only and should not in any way come across as a recommendation to buy or sell in these assets. You should do your own thorough research before making any investment decisions. FXStreet does not in any way guarantee that this information is free from mistakes, errors, or material misstatements. It also does not guarantee that this information is of a timely nature. Investing in Open Markets involves a great deal of risk, including the loss of all or a portion of your investment, as well as emotional distress. All risks, losses and costs associated with investing, including total loss of principal, are your responsibility. The views and opinions expressed in this article are those of the authors and do not necessarily reflect the official policy or position of FXStreet nor its advertisers. The author will not be held responsible for information that is found at the end of links posted on this page.
If not otherwise explicitly mentioned in the body of the article, at the time of writing, the author has no position in any stock mentioned in this article and no business relationship with any company mentioned. The author has not received compensation for writing this article, other than from FXStreet.
FXStreet and the author do not provide personalized recommendations. The author makes no representations as to the accuracy, completeness, or suitability of this information. FXStreet and the author will not be liable for any errors, omissions or any losses, injuries or damages arising from this information and its display or use. Errors and omissions excepted.
The author and FXStreet are not registered investment advisors and nothing in this article is intended to be investment advice.
Recommended Content
Editors’ Picks
AUD/USD remained bid above 0.6500

AUD/USD extended further its bullish performance, advancing for the fourth session in a row on Thursday, although a sustainable breakout of the key 200-day SMA at 0.6526 still remain elusive.
EUR/USD faces a minor resistance near at 1.0750

EUR/USD quickly left behind Wednesday’s small downtick and resumed its uptrend north of 1.0700 the figure, always on the back of the persistent sell-off in the US Dollar ahead of key PCE data on Friday.
Gold holds around $2,330 after dismal US data

Gold fell below $2,320 in the early American session as US yields shot higher after the data showed a significant increase in the US GDP price deflator in Q1. With safe-haven flows dominating the markets, however, XAU/USD reversed its direction and rose above $2,340.
Bitcoin price continues to get rejected from $65K resistance as SEC delays decision on spot BTC ETF options

Bitcoin (BTC) price has markets in disarray, provoking a broader market crash as it slumped to the $62,000 range on Thursday. Meanwhile, reverberations from spot BTC exchange-traded funds (ETFs) continue to influence the market.
US economy: slower growth with stronger inflation

The dollar strengthened, and stocks fell after statistical data from the US. The focus was on the preliminary estimate of GDP for the first quarter. Annualised quarterly growth came in at just 1.6%, down from the 2.5% and 3.4% previously forecast.