I haven’t written about the Nasdaq Composite (INDEXNASDAQ:.IXIC) for some time.
In fact, the last time I researched the subject was February 2015 (here’s the link). At that time, the Nasdaq was approaching its old highs (from 2000). I noted why that level was important resistance and what to expect on a breakout higher.
Here’s an excerpt from my February 2015 post:
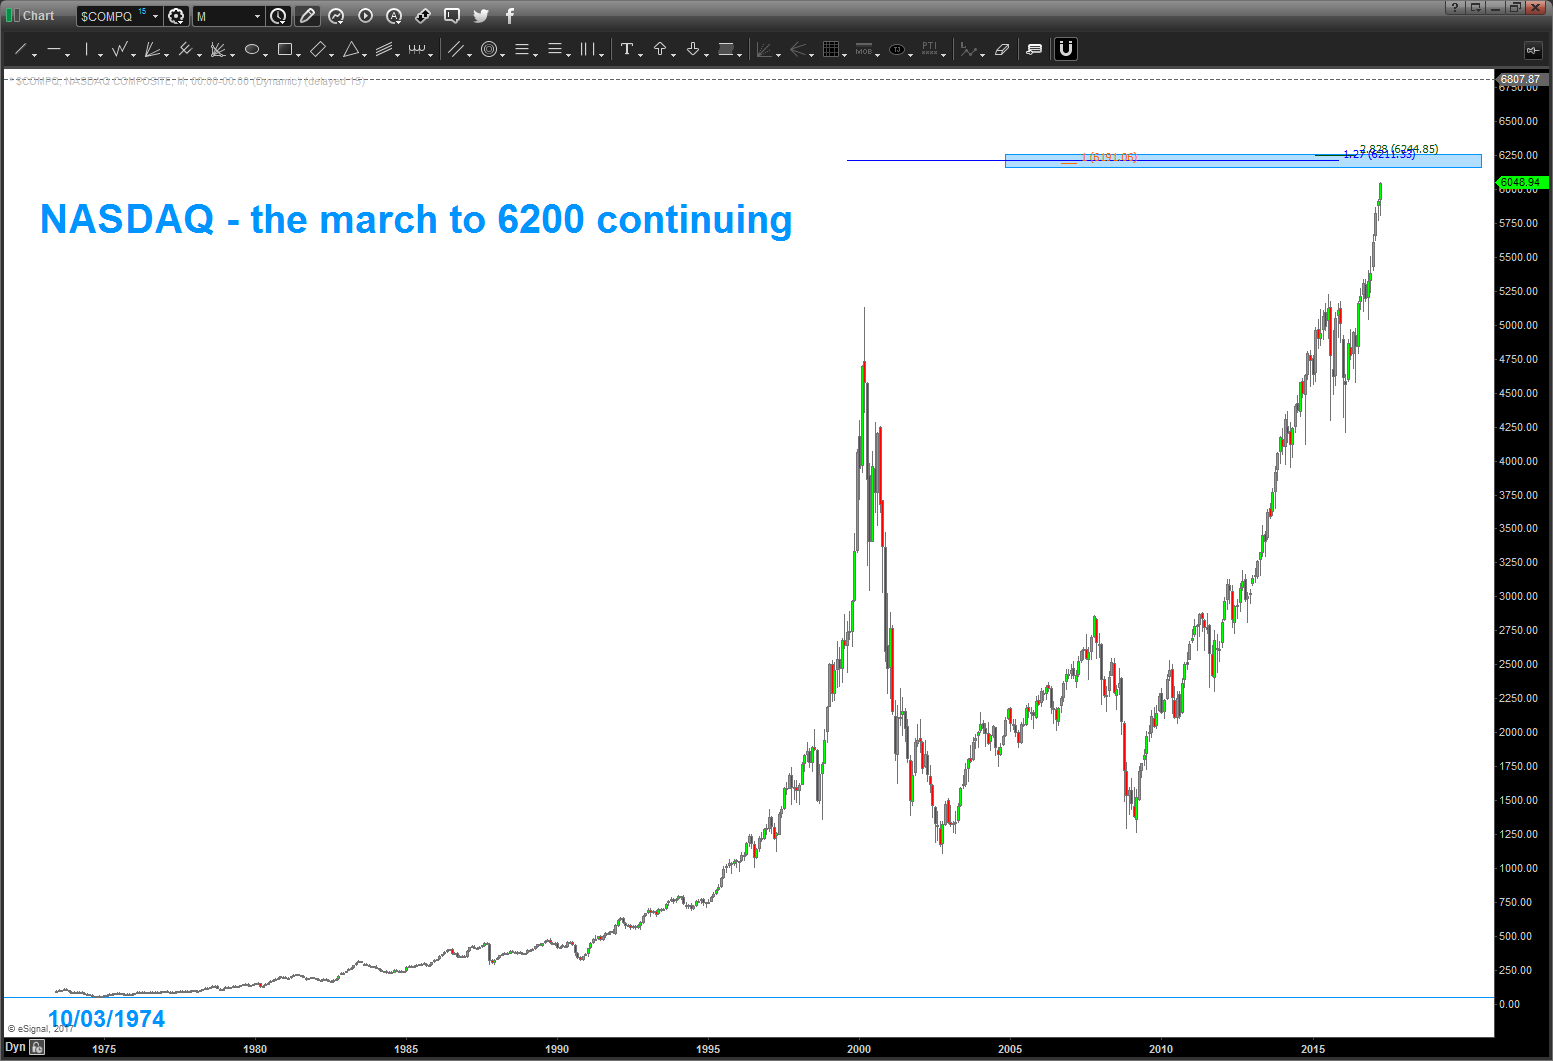
It certainly appears that the NASDAQ has a chance to explode to the upside. But it will have to get through the targets mentioned above and move with momentum… under that scenario, the NASDAQ would project to around 6200.
Well, as we already know, the Nasdaq broke out and its been rocketing towards our Nasdaq price target of 6200 ever since.
Folks, I’m not bearish and I’m not bullish here. I’m just a humble PATTERN recognition trader. The pattern in play is a monthly sell pattern at 6200. There’s no reason to insert investor bias here; this pattern simply says that this is an important resistance level. And note that it’s a longer-term chart so it’s worth watching here.
Nasdaq Composite Chart – Next Stop 6200?
Thanks for reading.
ALSO READ: 2017 German DAX Chart Outlook
Twitter: @BartsCharts
Author does not have a position in mentioned securities at the time of publication. Any opinions expressed herein are solely those of the author, and do not in any way represent the views or opinions of any other person or entity.


 Ready To Break Out?")

