

Form 10-Q NCI BUILDING SYSTEMS For: Apr 30
 Tweet
Tweet Share
ShareUNITED STATES
SECURITIES AND EXCHANGE COMMISSION
Washington, D.C. 20549
FORM 10-Q
(Mark One) | |
ý | QUARTERLY REPORT PURSUANT TO SECTION 13 OR 15(d) OF THE SECURITIES EXCHANGE ACT OF 1934 |
For the quarterly period ended April 30, 2017
or
¨ | TRANSITION REPORT PURSUANT TO SECTION 13 OR 15(d) OF THE SECURITIES EXCHANGE ACT OF 1934 |
For the transition period from to
Commission file number: 1-14315

NCI BUILDING SYSTEMS, INC.
(Exact name of registrant as specified in its charter)
Delaware | 76-0127701 |
(State or other jurisdiction of incorporation or organization) | (I.R.S. Employer Identification No.) |
10943 North Sam Houston Parkway West Houston, TX | 77064 |
(Address of principal executive offices) | (Zip Code) |
(281) 897-7788
(Registrant’s telephone number, including area code)
(Former name, former address and former fiscal year, if changed since last report)
Indicate by check mark whether the registrant (1) has filed all reports required to be filed by Section 13 or 15(d) of the Securities Exchange Act of 1934 during the preceding 12 months (or for such shorter period that the registrant was required to file such reports), and (2) has been subject to such filing requirements for the past 90 days. Yes ý No ¨
Indicate by check mark whether the registrant has submitted electronically and posted on its corporate Web site, if any, every Interactive Data File required to be submitted and posted pursuant to Rule 405 of Regulation S-T (§232.405 of this chapter) during the preceding 12 months (or for such shorter period that the registrant was required to submit and post such files). ý Yes ¨ No
Indicate by check mark whether the registrant is a large accelerated filer, an accelerated filer, a non-accelerated filer, a smaller reporting company, or an emerging growth company. See the definitions of “large accelerated filer,” “accelerated filer,” “smaller reporting company,” and “emerging growth company” in Rule 12b-2 of the Exchange Act.
Large accelerated filer | ¨ | Accelerated filer | ý |
Non-accelerated filer | ¨ (Do not check if a smaller reporting company) | Smaller reporting company | ¨ |
Emerging growth company | ¨ | ||
If an emerging growth company, indicate by check mark if the registrant has elected not to use the extended transition period for complying with any new or revised financial accounting standards provided pursuant to Section 13(a) of the Exchange Act. ¨
Indicate by check mark whether the registrant is a shell company (as defined in Rule 12b-2 of the Exchange Act). ¨ Yes ý No
APPLICABLE ONLY TO CORPORATE ISSUERS
Indicate the number of shares outstanding of each of the issuer’s classes of common stock, as of the latest practicable date.
Common Stock, $.01 par value - 70,899,742 shares as of June 1, 2017.
TABLE OF CONTENTS
PAGE | ||
Item 1. | ||
Item 2. | ||
Item 3. | ||
Item 4. | ||
Item 1. | ||
Item 1A. | ||
Item 2. | ||
Item 5. | ||
Item 6. | ||
i
PART I — FINANCIAL INFORMATION
Item 1. Unaudited Consolidated Financial Statements.
NCI BUILDING SYSTEMS, INC.
CONSOLIDATED BALANCE SHEETS
(In thousands, except share data)
(Unaudited)
April 30, 2017 | October 30, 2016 | ||||||
ASSETS | |||||||
Current assets: | |||||||
Cash and cash equivalents | $ | 49,682 | $ | 65,403 | |||
Restricted cash | 70 | 310 | |||||
Accounts receivable, net | 168,625 | 182,258 | |||||
Inventories, net | 195,441 | 186,824 | |||||
Income taxes receivable | — | 982 | |||||
Deferred income taxes | 26,126 | 29,104 | |||||
Investments in debt and equity securities, at market | 6,469 | 5,748 | |||||
Prepaid expenses and other | 39,452 | 29,971 | |||||
Assets held for sale | 5,044 | 4,256 | |||||
Total current assets | 490,909 | 504,856 | |||||
Property, plant and equipment, net | 234,831 | 242,212 | |||||
Goodwill | 154,291 | 154,271 | |||||
Intangible assets, net | 141,958 | 146,769 | |||||
Other assets, net | 1,824 | 2,092 | |||||
Total assets | $ | 1,023,813 | $ | 1,050,200 | |||
LIABILITIES AND STOCKHOLDERS’ EQUITY | |||||||
Current liabilities: | |||||||
Note payable | $ | 1,373 | $ | 460 | |||
Accounts payable | 121,177 | 142,913 | |||||
Accrued compensation and benefits | 55,760 | 72,612 | |||||
Accrued interest | 6,156 | 7,165 | |||||
Accrued income taxes | 1,119 | — | |||||
Other accrued expenses | 102,580 | 103,384 | |||||
Total current liabilities | 288,165 | 326,534 | |||||
Long-term debt, net of deferred financing costs of $7,341 and $8,096 on April 30, 2017 and October 30, 2016, respectively | 386,806 | 396,051 | |||||
Deferred income taxes | 24,701 | 24,804 | |||||
Other long-term liabilities | 21,267 | 21,494 | |||||
Total long-term liabilities | 432,774 | 442,349 | |||||
Stockholders’ equity: | |||||||
Common stock, $.01 par value, 100,000,000 shares authorized; 71,191,046 and 71,581,273 shares issued at April 30, 2017 and October 30, 2016, respectively; 70,899,918 and 70,806,202 shares outstanding at April 30, 2017 and October 30, 2016, respectively | 712 | 715 | |||||
Additional paid-in capital | 598,670 | 603,120 | |||||
Accumulated deficit | (283,757 | ) | (302,706 | ) | |||
Accumulated other comprehensive loss, net | (10,611 | ) | (10,553 | ) | |||
Treasury stock, at cost (291,128 and 775,071 shares at April 30, 2017 and October 30, 2016, respectively) | (2,140 | ) | (9,259 | ) | |||
Total stockholders’ equity | 302,874 | 281,317 | |||||
Total liabilities and stockholders’ equity | $ | 1,023,813 | $ | 1,050,200 | |||
See accompanying notes to consolidated financial statements.
1
NCI BUILDING SYSTEMS, INC.
CONSOLIDATED STATEMENTS OF OPERATIONS
(In thousands, except per share data)
(Unaudited)
Fiscal Three Months Ended | Fiscal Six Months Ended | ||||||||||||||
April 30, 2017 | May 1, 2016 | April 30, 2017 | May 1, 2016 | ||||||||||||
Sales | $ | 420,464 | $ | 372,247 | $ | 812,167 | $ | 742,261 | |||||||
Cost of sales | 319,488 | 283,799 | 627,240 | 564,822 | |||||||||||
Loss (gain) on sale of assets and asset recovery | 137 | (927 | ) | 137 | (1,652 | ) | |||||||||
Gross profit | 100,839 | 89,375 | 184,790 | 179,091 | |||||||||||
Engineering, selling, general and administrative expenses | 75,124 | 74,648 | 144,164 | 144,498 | |||||||||||
Intangible asset amortization | 2,405 | 2,405 | 4,810 | 4,821 | |||||||||||
Strategic development and acquisition related costs | 124 | 579 | 481 | 1,260 | |||||||||||
Restructuring and impairment charges | 315 | 1,149 | 2,578 | 2,659 | |||||||||||
Gain on insurance recovery | (9,601 | ) | — | (9,601 | ) | — | |||||||||
Income from operations | 32,472 | 10,594 | 42,358 | 25,853 | |||||||||||
Interest income | 138 | 52 | 144 | 74 | |||||||||||
Interest expense | (7,479 | ) | (7,844 | ) | (14,365 | ) | (15,713 | ) | |||||||
Foreign exchange gain (loss) | 127 | 576 | 50 | (166 | ) | ||||||||||
Gain from bargain purchase | — | — | — | 1,864 | |||||||||||
Other income, net | 322 | 251 | 708 | 62 | |||||||||||
Income before income taxes | 25,580 | 3,629 | 28,895 | 11,974 | |||||||||||
Provision for income taxes | 8,606 | 1,209 | 9,882 | 3,662 | |||||||||||
Net income | $ | 16,974 | $ | 2,420 | $ | 19,013 | $ | 8,312 | |||||||
Net income allocated to participating securities | (115 | ) | (23 | ) | (131 | ) | (79 | ) | |||||||
Net income applicable to common shares | $ | 16,859 | $ | 2,397 | $ | 18,882 | $ | 8,233 | |||||||
Income per common share: | |||||||||||||||
Basic | $ | 0.24 | $ | 0.03 | $ | 0.27 | $ | 0.11 | |||||||
Diluted | $ | 0.24 | $ | 0.03 | $ | 0.27 | $ | 0.11 | |||||||
Weighted average number of common shares outstanding: | |||||||||||||||
Basic | 70,988 | 72,352 | 70,933 | 72,806 | |||||||||||
Diluted | 71,122 | 72,886 | 71,107 | 73,321 | |||||||||||
See accompanying notes to consolidated financial statements.
2
NCI BUILDING SYSTEMS, INC.
CONSOLIDATED STATEMENTS OF COMPREHENSIVE INCOME (LOSS)
(In thousands)
(Unaudited)
Fiscal Three Months Ended | Fiscal Six Months Ended | ||||||||||||||
April 30, 2017 | May 1, 2016 | April 30, 2017 | May 1, 2016 | ||||||||||||
Comprehensive income (loss): | |||||||||||||||
Net income | $ | 16,974 | $ | 2,420 | $ | 19,013 | $ | 8,312 | |||||||
Other comprehensive income (loss), net of tax: | |||||||||||||||
Foreign exchange translation gains (losses) and other(1) | (144 | ) | 492 | (58 | ) | 151 | |||||||||
Other comprehensive income (loss) | (144 | ) | 492 | (58 | ) | 151 | |||||||||
Comprehensive income | $ | 16,830 | $ | 2,912 | $ | 18,955 | $ | 8,463 | |||||||
(1) | Foreign exchange translation gains (losses) and other are presented net of taxes of $0 in both the three months ended April 30, 2017 and May 1, 2016, and $0 in both the six months ended April 30, 2017 and May 1, 2016. |
See accompanying notes to consolidated financial statements.
3
NCI BUILDING SYSTEMS, INC.
CONSOLIDATED STATEMENTS OF STOCKHOLDERS’ EQUITY
(In thousands, except share data)
(Unaudited)
Additional | Retained | Accumulated Other | |||||||||||||||||||||||||||
Common Stock | Paid-In | Earnings | Comprehensive | Treasury Stock | Stockholders’ | ||||||||||||||||||||||||
Shares | Amount | Capital | (Deficit) | (Loss) Income | Shares | Amount | Equity | ||||||||||||||||||||||
Balance, October 30, 2016 | 71,581,273 | $ | 715 | $ | 603,120 | $ | (302,706 | ) | $ | (10,553 | ) | (775,071 | ) | $ | (9,259 | ) | $ | 281,317 | |||||||||||
Treasury stock purchases | — | — | — | — | — | (402,825 | ) | (5,922 | ) | (5,922 | ) | ||||||||||||||||||
Retirement of treasury shares | (888,435 | ) | (8 | ) | (12,898 | ) | — | — | 888,435 | 12,906 | — | ||||||||||||||||||
Issuance of restricted stock | 362,946 | 4 | (4 | ) | — | — | (19,806 | ) | — | — | |||||||||||||||||||
Stock options exercised | 135,027 | 1 | 1,195 | — | — | — | — | 1,196 | |||||||||||||||||||||
Excess tax benefits from share-based compensation arrangements | — | — | 1,515 | — | — | — | — | 1,515 | |||||||||||||||||||||
Foreign exchange translation gain and other, net of taxes | — | — | 15 | (64 | ) | (58 | ) | — | — | (107 | ) | ||||||||||||||||||
Deferred compensation obligation | 235 | — | (135 | ) | — | — | 18,139 | 135 | — | ||||||||||||||||||||
Share-based compensation | — | — | 5,862 | — | — | — | — | 5,862 | |||||||||||||||||||||
Net income | — | — | — | 19,013 | — | — | — | 19,013 | |||||||||||||||||||||
Balance, April 30, 2017 | 71,191,046 | $ | 712 | $ | 598,670 | $ | (283,757 | ) | $ | (10,611 | ) | (291,128 | ) | $ | (2,140 | ) | $ | 302,874 | |||||||||||
See accompanying notes to consolidated financial statements.
4
NCI BUILDING SYSTEMS, INC.
CONSOLIDATED STATEMENTS OF CASH FLOWS
(In thousands)
(Unaudited)
Fiscal Six Months Ended | |||||||
April 30, 2017 | May 1, 2016 | ||||||
Cash flows from operating activities: | |||||||
Net income | $ | 19,013 | $ | 8,312 | |||
Adjustments to reconcile net income to net cash from operating activities: | |||||||
Depreciation and amortization | 20,378 | 21,512 | |||||
Amortization of deferred financing costs | 954 | 954 | |||||
Share-based compensation expense | 5,862 | 5,050 | |||||
Gain on insurance recovery | (9,601 | ) | — | ||||
Losses (gains) on assets, net | 262 | (3,516 | ) | ||||
Provision for doubtful accounts | 1,406 | 1,898 | |||||
Provision for deferred income taxes | (113 | ) | 1,668 | ||||
Excess tax (benefits) shortfalls from share-based compensation arrangements | (1,515 | ) | 390 | ||||
Changes in operating assets and liabilities, net of effect of acquisitions: | |||||||
Accounts receivable | 12,232 | 25,299 | |||||
Inventories | (8,617 | ) | 6,555 | ||||
Income taxes receivable | 982 | (4,140 | ) | ||||
Prepaid expenses and other | (1,875 | ) | 3,699 | ||||
Accounts payable | (21,737 | ) | (24,633 | ) | |||
Accrued expenses | (11,068 | ) | (22,976 | ) | |||
Other, net | (189 | ) | (59 | ) | |||
Net cash provided by operating activities | 6,374 | 20,013 | |||||
Cash flows from investing activities: | |||||||
Acquisitions, net of cash acquired | — | (4,343 | ) | ||||
Capital expenditures | (11,556 | ) | (10,280 | ) | |||
Proceeds from sale of property, plant and equipment | 2,533 | 4,663 | |||||
Proceeds from insurance | 420 | — | |||||
Net cash used in investing activities | (8,603 | ) | (9,960 | ) | |||
Cash flows from financing activities: | |||||||
Refund (deposit) of restricted cash | 240 | (49 | ) | ||||
Proceeds from stock options exercised | 1,196 | 1,401 | |||||
Excess tax benefits (shortfalls) from share-based compensation arrangements | 1,515 | (390 | ) | ||||
Proceeds from Amended ABL facility | 35,000 | — | |||||
Payments on Amended ABL facility | (35,000 | ) | — | ||||
Payments on term loan | (10,000 | ) | (20,000 | ) | |||
Payments on note payable | (458 | ) | (531 | ) | |||
Purchases of treasury stock | (5,922 | ) | (12,381 | ) | |||
Net cash used in financing activities | (13,429 | ) | (31,950 | ) | |||
Effect of exchange rate changes on cash and cash equivalents | (63 | ) | 151 | ||||
Net decrease in cash and cash equivalents | (15,721 | ) | (21,746 | ) | |||
Cash and cash equivalents at beginning of period | 65,403 | 99,662 | |||||
Cash and cash equivalents at end of period | $ | 49,682 | $ | 77,916 | |||
See accompanying notes to consolidated financial statements.
5
NCI BUILDING SYSTEMS, INC.
NOTES TO CONSOLIDATED FINANCIAL STATEMENTS
April 30, 2017
(Unaudited)
NOTE 1 — SUMMARY OF SIGNIFICANT ACCOUNTING POLICIES
Basis of Presentation
The accompanying unaudited consolidated financial statements for NCI Building Systems, Inc. (together with its subsidiaries, unless otherwise indicated, the “Company,” “NCI,” “we,” “us” or “our”) have been prepared in accordance with generally accepted accounting principles for interim financial information and with the instructions to Form 10-Q and Article 10 of Regulation S-X. Accordingly, they do not include all of the information and footnotes required by generally accepted accounting principles for complete financial statements. In the opinion of management, the unaudited consolidated financial statements included herein contain all adjustments, which consist of normal recurring adjustments, necessary to fairly present our financial position, results of operations and cash flows for the periods indicated. Operating results for the fiscal three and six month periods ended April 30, 2017 are not necessarily indicative of the results that may be expected for the fiscal year ending October 29, 2017. Our sales and earnings are subject to both seasonal and cyclical trends and are influenced by general economic conditions, interest rates, the price of steel relative to other building materials, the level of nonresidential construction activity, roof repair and retrofit demand and the availability and cost of financing for construction projects.
For further information, refer to the consolidated financial statements and footnotes thereto included in our Annual Report on Form 10-K for the fiscal year ended October 30, 2016 filed with the Securities and Exchange Commission (the “SEC”) on January 9, 2017.
Reporting Periods
We use a four-four-five week calendar each quarter with our fiscal year end being on the Sunday closest to October 31. The year end for fiscal 2017 is October 29, 2017.
Gain on Insurance Recovery
In June 2016, the Company experienced a fire at a facility in the metal components segment. During the second quarter of fiscal 2017, the Company settled the property damage claims with the insurers for actual cash value of $18.0 million. Of this amount, the Company received proceeds of $10.0 million from our insurers during the fourth quarter of fiscal 2016. The remaining $8.0 million was recorded as an insurance receivable on the consolidated balance sheet as of April 30, 2017 in prepaid and other assets. We subsequently received proceeds from the insurers in May 2017 in full satisfaction of the insurance receivable.
Approximately $8.8 million was previously recognized to offset the loss on involuntary conversion and other amounts incurred related to the incident. The remaining $9.2 million was recognized as a gain on insurance recovery in the consolidated statement of operations at April 30, 2017 as the associated contingency was resolved.
The Company’s property insurance policy is a replacement cost policy such that the Company will be reimbursed an additional amount of up to $4.7 million for the difference between the actual cash value and the replacement cost if and when the property is replaced and/or new assets are acquired. Such amount will only be recognized in the Company’s financial statements upon resolution of the associated contingency. Additionally, the Company anticipates additional insurance recoveries may be received for business interruption claims related to the fire.
The Company also settled an outstanding claim with insurers for hail damage sustained at a facility within the metal components segment. The Company received proceeds of $0.4 million, which was recognized as a gain on insurance recovery in the consolidated statement of operations during the three month period ended April 30, 2017.
NOTE 2 — ACQUISITION
Fiscal 2016 acquisition
On November 3, 2015, we acquired manufacturing operations in Hamilton, Ontario, Canada for cash consideration of $2.2 million, net of post-closing working capital adjustments. This business allows us to service customers more competitively within the Canadian and Northeastern United States insulated metal panel (“IMP”) markets. Because the business was acquired from a seller in connection with a divestment required by a regulatory authority, the fair value of net assets acquired exceeded the purchase consideration by $1.9 million, which was recorded as a non-taxable gain from bargain purchase in the unaudited consolidated statements of operations during the first quarter of fiscal 2016.
6
The fair values of the assets acquired and liabilities assumed as part of this acquisition as of November 3, 2015, as determined in accordance with ASC Topic 805, were as follows (in thousands):
November 3, 2015 | ||||
Current assets | $ | 307 | ||
Property, plant and equipment | 4,810 | |||
Assets acquired | 5,117 | |||
Current liabilities assumed | 380 | |||
Fair value of net assets acquired | 4,737 | |||
Total cash consideration transferred | 2,201 | |||
Deferred tax liabilities | 672 | |||
Gain from bargain purchase | $ | (1,864 | ) | |
The results of operations for this business are included in our metal components segment. Pro forma financial information and other disclosures for this acquisition have not been presented as it is not material to the Company’s financial position or operating results.
NOTE 3 — ACCOUNTING PRONOUNCEMENTS
Adopted Accounting Pronouncements
In June 2014, the FASB issued ASU 2014-12, Accounting for Share-Based Payments When the Terms of an Award Provide That a Performance Target Could Be Achieved after the Requisite Service Period. ASU 2014-12 requires that a performance target that affects vesting and could be achieved after the requisite service period be treated as a performance condition. A reporting entity should apply existing guidance in ASC Topic 718, Compensation - Stock Compensation, as it relates to such awards. We adopted this guidance in our first quarter in fiscal 2017 on a prospective basis. The adoption of this guidance did not have any impact on our financial position or results of operations.
In January 2015, the FASB issued ASU 2015-01, Income Statement — Extraordinary and Unusual Items (Subtopic 225-20): Simplifying Income Statement Presentation by Eliminating the Concept of Extraordinary Items. ASU 2015-01 eliminates from U.S. GAAP the concept of extraordinary items. We adopted ASU 2015-01 prospectively in our first quarter in fiscal 2017. The adoption of this guidance did not have any impact on our financial position or results of operations.
In April 2015, the FASB issued ASU 2015-04, Practical Expedient for the Measurement Date of an Employer’s Defined Benefit Obligation and Plan Assets. This ASU provides a practical expedient option to entities that have defined benefit plans and have a fiscal year end that does not coincide with a calendar month end. This ASU allows an entity to elect to measure defined benefit plan assets and obligations using the calendar month-end that is closest to its fiscal year end. We adopted ASU 2015-04 prospectively in our first quarter in fiscal 2017. The adoption of this standard did not have any impact on our consolidated financial statements as presented; however, the future impact of ASU 2015-04 will be dependent upon the nature of future significant events, if any, impacting the Company’s pension plans.
In April 2015, the FASB issued ASU 2015-05, Intangibles — Goodwill and Other — Internal-Use Software (Subtopic 350-40): Customer’s Accounting for Fees Paid in a Cloud Computing Arrangement. ASU 2015-05 provides guidance to customers about whether a cloud computing arrangement includes a software license. If a cloud computing arrangement includes a software license, the guidance specifies that the customer should account for the software license element of the arrangement consistent with the acquisition of other software licenses. ASU 2015-05 further specifies that the customer should account for a cloud computing arrangement as a service contract if the arrangement does not include a software license. We adopted ASU 2015-05 in our first quarter in fiscal 2017 on a prospective basis and, accordingly, the adoption of this guidance did not have a material impact on our consolidated financial statements.
In April 2015, the FASB issued ASU 2015-03, Interest - Imputation of Interest (Subtopic 835-30): Simplifying the Presentation of Debt Issuance Costs. ASU 2015-03 requires debt issuance costs related to a recognized debt liability be presented on the balance sheet as a direct deduction from the carrying amount of the related debt liability instead of being presented as a separate asset. The retrospective adoption of this guidance in the first quarter of our fiscal 2017 resulted in a reclassification of approximately $8.1 million in deferred financing costs as of October 30, 2016 associated with our Notes and Credit Agreement (as defined in Note 11—Long-Term Debt and Note Payable) from other assets to long-term debt on our consolidated balance sheets.
In August 2015, FASB issued ASU 2015-15, Interest - Imputation of Interest (Subtopic 835-30) - Presentation and Subsequent Measurement of Debt Issuance Costs Associated with Line-of-Credit Arrangements (Amendments to SEC Paragraphs Pursuant to Staff Announcement at June 18, 2015 EITF Meeting), to provide further clarification to ASU 2015-03 as it relates to the
7
presentation and subsequent measurement of debt issuance costs associated with line of credit arrangements. Under this guidance, these costs may be presented as an asset and amortized ratably over the term of the line-of-credit arrangement, regardless of whether there are outstanding borrowings on the arrangement. We adopted this guidance in our first quarter in fiscal 2017 on a retrospective basis. The adoption of this guidance did not have any impact on our financial position as the deferred financing costs associated with our Amended ABL Facility remain classified in other assets on the consolidated balance sheets.
Recent Accounting Pronouncements
In May 2014, the FASB issued ASU 2014-09, Revenue from Contracts with Customers (Topic 606). ASU 2014-09 supersedes the revenue recognition requirements in ASC Topic 605, Revenue Recognition, and most industry-specific guidance. The core principle of the guidance is that an entity should recognize revenue to depict the transfer of promised goods or services to customers in an amount that reflects the consideration to which the entity expects to be entitled in exchange for those goods or services. During 2016, the FASB also issued ASU 2016-08, Revenue from Contracts with Customers: Principal versus Agent Considerations (Reporting Revenue Gross versus Net); ASU 2016-10, Revenue from Contracts with Customers: Identifying Performance Obligations and Licensing; ASU 2016-11, Rescission of SEC Guidance Because of Accounting Standards Updates 2014-09 and 2014-16 Pursuant to Staff Announcements at the March 3, 2016 EITF Meeting; and ASU 2016-12, Revenue from Contracts with Customers: Narrow-Scope Improvements and Practical Expedients; and ASU 2016-20, Technical Corrections and Improvements to Topic 606, Revenue from Contracts with Customers, all of which were issued to improve and clarify the guidance in ASU 2014-09. These ASUs are effective for our fiscal year ending November 3, 2019, including interim periods within that fiscal year, and will be adopted using either a full or modified retrospective approach. We are currently assessing the potential effects of these changes to our consolidated financial statements.
In July 2015, the FASB issues ASU 2015-11, Inventory (Topic 330): Simplifying the Measurement of Inventory. ASU 2015-11 requires that inventory that has historically been measured using first-in, first-out (FIFO) or average cost method should now be measured at the lower of cost and net realizable value. The update requires prospective application and is effective for our fiscal year ending October 28, 2018, including interim periods within that fiscal year. We do not expect that the adoption of this guidance will have a material impact on our consolidated financial statements.
In November 2015, the FASB issued ASU 2015-17, Balance Sheet Classification of Deferred Taxes. ASU 2015-17 requires all deferred tax assets and liabilities to be presented on the balance sheet as noncurrent. ASU 2015-17 is effective for our fiscal year ending October 28, 2018, including interim periods within that fiscal year. Upon adoption, we will present the net deferred tax assets as noncurrent and reclassify any current deferred tax assets and liabilities in our consolidated financial position on a retrospective basis.
In February 2016, the FASB issued ASU 2016-02, Leases, which will require lessees to record most leases on the balance sheet and modifies the classification criteria and accounting for sales-type leases and direct financing leases for lessors. ASU 2016-02 is effective for our fiscal year ending November 1, 2020, including interim periods within that fiscal year. The guidance requires entities to use a modified retrospective approach for leases that exist or are entered into after the beginning of the earliest comparative period in the financial statements. We are evaluating the impact that the adoption of this guidance will have on our consolidated financial statements.
In March 2016, the FASB issued ASU 2016-09, Improvements to Employee Share-Based Payment Accounting, which is intended to simplify certain aspects of the accounting for share-based payment award transactions, including income tax effects when awards vest or settle, repurchase of employees’ shares to satisfy statutory tax withholding obligations, an option to account for forfeitures as they occur, and classification of certain amounts on the statement of cash flows. ASU 2016-09 is effective for our fiscal year ending October 28, 2018, including interim periods within that fiscal year. We are evaluating the impact that the adoption of this ASU will have on our consolidated financial statements.
In June 2016, the FASB issued ASU 2016-13, Financial Instruments—Credit Losses (Topic 326): Measurement of Credit Losses on Financial Instruments. This ASU requires an entity to measure all expected credit losses for financial assets, including trade receivables, held at the reporting date based on historical experience, current conditions, and reasonable and supportable forecasts. Entities will now incorporate forward-looking information based on expected losses to estimate credit losses. ASU 2016-13 is effective for our fiscal year ending October 31, 2021, including interim periods within that fiscal year. We are evaluating the impact that the adoption of this ASU will have on our consolidated financial position, result of operations and cash flows.
In August 2016, the FASB issued ASU No. 2016-15, Statement of Cash Flows (Topic 230): Classification of Certain Cash Receipts and Cash Payments, which provides guidance on eight cash flow classification issues with the objective of reducing differences in practice. We will be required to adopt the amendments in this ASU in annual and interim periods for our fiscal year ending November 3, 2019, with early adoption permitted. Adoption is required to be on a retrospective basis, unless impracticable for any of the amendments, in which case a prospective application is permitted. We are evaluating the impact that ASU 2016-15 will have on our consolidated financial statements.
8
In October 2016, the FASB issued ASU 2016-16, Income Taxes (Topic 740): Intra-Entity Transfers of Assets Other than Inventory, which eliminates the exception that prohibits the recognition of current and deferred income tax effects for intra-entity transfers of assets other than inventory until the asset has been sold to an outside party. We will be required to adopt the amendments in this ASU in the annual and interim periods for our fiscal year ending November 3, 2019, with early adoption permitted. The application of the amendments will require the use of a modified retrospective basis through a cumulative-effect adjustment to retained earnings as of the beginning of the period of adoption. We are evaluating the standard and the impact it will have on our consolidated financial statements.
In November 2016, the FASB issued ASU 2016-18, Statement of Cash Flows (Topic 230): Restricted Cash (a consensus of the FASB Emerging Issues Task Force), which clarifies how entities should present restricted cash and restricted cash equivalents in the statement of cash flows. Entities will no longer present transfers between cash and cash equivalents and restricted cash and restricted cash equivalents in the statement of cash flows. An entity with a material balance of restricted cash and restricted cash equivalents must disclose information about the nature of the restrictions. We will be required to adopt this guidance on a retrospective basis in the annual and interim periods for our fiscal year ending November 3, 2019, with early adoption permitted. We are evaluating the impact ASU 2016-18 will have on our consolidated financial statements.
In January 2017, the FASB issued ASU 2017-01, Business Combinations (Topic 805): Clarifying the Definition of a Business. This ASU adds guidance to assist entities with evaluating whether transactions should be accounted for as acquisitions (or disposals) of assets or businesses. Under the new guidance, if a single asset or group of similar identifiable assets comprise substantially all of the fair value of the gross assets acquired (or disposed of) in a transaction, the assets and related activities are not a business. Also, a minimum of an input process and a substantive process must be present and significantly contribute to the ability to create outputs in order to be considered a business. We will be required to adopt this guidance on a prospective basis in the annual and interim periods for our fiscal year ending November 3, 2019, with early adoption permitted. We are evaluating the impact ASU 2017-01 will have on our consolidated financial statements.
In January 2017, the FASB issued ASU 2017-04, Intangibles—Goodwill and Other (Topic 350): Simplifying the Test for Goodwill Impairment. This ASU eliminates Step 2 from the goodwill impairment test and requires an entity to perform its goodwill impairment test by comparing the fair value of a reporting unit with its carrying amount. Under this guidance, an entity should recognize an impairment charge for the amount by which the carrying amount exceeds the reporting unit’s fair value. We will be required to adopt the amendments in this ASU on a prospective basis in the annual and interim periods for our fiscal year ending October 31, 2021, with early adoption permitted. We are evaluating the impact ASU 2017-04 will have on our consolidated financial statements.
In February 2017, the FASB issued ASU 2017-05, Other Income—Gains and Losses from the Derecognition of Nonfinancial Assets (Subtopic 610-20): Clarifying the Scope of Asset Derecognition Guidance and Accounting for Partial Sales of Nonfinancial Assets, which clarifies the scope of guidance on nonfinancial asset derecognition in Accounting Standards Codification 610-20 and the accounting for partial sales of nonfinancial assets. The new guidance also conforms the derecognition guidance for nonfinancial assets with the model in the new revenue standard (ASU 2014-09). We will be required to adopt this guidance on a prospective basis in the annual and interim periods for our fiscal year ending November 3, 2019, and the Company is required to apply the amendments at the same time that it applies the amendments in ASU 2014-09. We are evaluating the impact of adopting this guidance.
In March 2017, the FASB issued ASU 2017-07, Compensation—Retirement Benefits (Topic 715): Improving the Presentation of Net Periodic Pension Cost and Net Periodic Postretirement Benefit Cost, which amends the requirements related to the income statement presentation of the components of net periodic benefit cost for employer sponsored defined benefit pension and other postretirement benefit plans. Under the new guidance, an entity must disaggregate and present the service cost component of net periodic benefit cost in the same income statement line items as other employee compensation costs arising from services rendered during the period, and only the service cost component will be eligible for capitalization. Other components of net periodic benefit cost will be presented separately from the line items that include the service cost. We will be required to adopt this guidance on a prospective basis in the annual and interim periods for our fiscal year ending November 3, 2019, with early adoption permitted. Entities must use a retrospective transition method to adopt the requirement for separate presentation of the income statement service cost and other components, and a prospective transition method to adopt the requirement to limit the capitalization of benefit cost to the service component. We are evaluating the impact of adopting this guidance.
In May 2017, the FASB issued ASU 2017-09, Compensation—Stock Compensation (Topic 718): Scope of Modification Accounting, which provides clarity on the accounting for modifications of stock-based awards. We will be required to adopt this guidance on a prospective basis in the annual and interim periods for our fiscal year ending November 3, 2019 for share-based payment awards modified on or after the adoption date. We are evaluating the impact ASU 2017-09 will have on our consolidated financial statements.
9
NOTE 4 —RESTRUCTURING AND ASSET IMPAIRMENTS
As part of the plans developed in the fourth quarter of fiscal 2015 primarily to improve ESG&A and manufacturing cost efficiency and to optimize our combined manufacturing footprint given the Company’s acquisitions and restructuring efforts, we incurred restructuring charges, primarily consisting of severance related costs of $0.3 million, including $0.2 million and $0.1 million in the engineered building systems segment and metal components segment, respectively, during the three months ended April 30, 2017. During the three months ended May 1, 2016, we incurred restructuring charges, primarily consisting of severance related costs of $1.1 million, including $0.1 million and $0.6 million in the engineered building systems segment and metal components segment, respectively, and $0.4 million at corporate.
For the six months ended April 30, 2017, we incurred restructuring charges, primarily consisting of severance related costs of $2.6 million, including approximately $2.1 million and $0.5 million in the engineered building systems segment and metal components segment, respectively. For the six months ended May 1, 2016, we incurred restructuring charges, primarily consisting of severance related costs of $2.7 million, including $0.6 million and $0.9 million in the engineered building systems segment and metal components segment, respectively, and $1.2 million at corporate.
The following table summarizes the costs and charges associated with the restructuring plans during the three and six months ended April 30, 2017, which are recorded in restructuring and impairment charges in the Company’s consolidated statements of operations (in thousands):
Fiscal Three Months Ended | Fiscal Six Months Ended | ||||||||||
April 30, 2017 | April 30, 2017 | Cost Incurred To Date (since inception) | |||||||||
General severance | $ | 155 | $ | 1,043 | $ | 8,387 | |||||
Plant closing severance | 90 | 1,330 | 3,070 | ||||||||
Asset impairments | — | 125 | 5,969 | ||||||||
Other restructuring costs | 70 | 80 | 711 | ||||||||
Total restructuring costs | $ | 315 | $ | 2,578 | $ | 18,137 | |||||
We expect to fully execute our plans in phases over the next 24 months and estimate that we will incur future additional restructuring charges associated with these plans. We are unable at this time to make a good faith determination of cost estimates, or ranges of cost estimates, associated with future phases of these plans.
The following table summarizes our severance liability and cash payments made pursuant to the restructuring plans from inception through April 30, 2017 (in thousands):
General Severance | Plant Closing Severance | Total | |||||||||
Balance at November 2, 2014 | $ | — | $ | — | $ | — | |||||
Costs incurred | 3,887 | 1,575 | 5,462 | ||||||||
Cash payments | (2,941 | ) | (1,575 | ) | (4,516 | ) | |||||
Accrued severance(1) | 739 | — | 739 | ||||||||
Balance at November 1, 2015 | $ | 1,685 | $ | — | $ | 1,685 | |||||
Costs incurred(1) | 2,725 | 165 | 2,890 | ||||||||
Cash payments | (3,928 | ) | (165 | ) | (4,093 | ) | |||||
Balance at October 30, 2016 | $ | 482 | $ | — | $ | 482 | |||||
Costs incurred and other | 1,043 | 1,330 | 2,373 | ||||||||
Cash payments | (1,317 | ) | (1,330 | ) | (2,647 | ) | |||||
Balance at April 30, 2017 | $ | 208 | $ | — | $ | 208 | |||||
(1) | During the second and fourth quarters of fiscal 2015, we entered into transition and separation agreements with certain executive officers. Each terminated executive officer was entitled to severance benefit payments issuable in two installments. The termination benefits were measured initially at the separation dates based on the fair value of the liability as of the termination date and were recognized ratably over the future service period. Costs incurred during fiscal 2016 exclude $0.7 million of amortization expense associated with these termination benefits. |
10
NOTE 5 — INVENTORIES
The components of inventory are as follows (in thousands):
April 30, 2017 | October 30, 2016 | ||||||
Raw materials | $ | 148,555 | $ | 145,060 | |||
Work in process and finished goods | 46,886 | 41,764 | |||||
$ | 195,441 | $ | 186,824 | ||||
NOTE 6 — ASSETS HELD FOR SALE
We record assets held for sale at the lower of the carrying value or fair value less costs to sell. The following criteria are used to determine if property is held for sale: (i) management has the authority and commits to a plan to sell the property; (ii) the property is available for immediate sale in its present condition; (iii) there is an active program to locate a buyer and the plan to sell the property has been initiated; (iv) the sale of the property is probable within one year; (v) the property is being actively marketed at a reasonable sale price relative to its current fair value; and (vi) it is unlikely that the plan to sell will be withdrawn or that significant changes to the plan will be made.
In determining the fair value of the assets less cost to sell, we consider factors including current sales prices for comparable assets in the area, recent market analysis studies, appraisals and any recent legitimate offers. If the estimated fair value less cost to sell of an asset is less than its current carrying value, the asset is written down to its estimated fair value less cost to sell. During the three months ended April 30, 2017, we reclassified $3.4 million from property, plant and equipment to assets held for sale for idled facilities in our engineered building systems segment of $2.9 million and our metal components segment of $0.5 million that met the held for sale criteria. The total carrying value of assets held for sale (primarily representing idled facilities in our engineered building systems segment) was $5.0 million and $4.3 million as of April 30, 2017 and October 30, 2016, respectively. All of these assets continued to be actively marketed for sale or are under contract at April 30, 2017.
During the three months ended April 30, 2017, we completed the sale of an idle facility in the engineered building systems segment, along with related equipment, which had previously been classified in assets held for sale. In connection with the sale of these assets, we received net cash proceeds of $2.5 million, and recognized a net loss of $0.1 million, which is included in loss (gain) on sale of assets and asset recovery in the consolidated statements of operations.
Due to uncertainties in the estimation process, it is reasonably possible that actual results could differ from the estimates used in our historical analysis. Our assumptions about property sales prices require significant judgment because the current market is highly sensitive to changes in economic conditions. We determined the estimated fair values of assets held for sale based on current market conditions and assumptions made by management, which may differ from actual results and may result in impairments if market conditions deteriorate.
NOTE 7 — SHARE-BASED COMPENSATION
Our 2003 Long-Term Stock Incentive Plan (“Incentive Plan”) is an equity-based compensation plan that allows us to grant a variety of types of awards, including stock options, restricted stock, restricted stock units, stock appreciation rights, performance share units (“PSUs”), phantom stock awards, long-term incentive awards with performance conditions (“Performance Share Awards”) and cash awards. Awards are generally granted once per year, with the amounts and types of awards determined by the Compensation Committee of our Board of Directors (the “Committee”). As a general rule, option awards terminate on the earlier of (i) 10 years from the date of grant, (ii) 30 days after termination of employment or service for a reason other than death, disability or retirement, (iii) one year after death or (iv) one year for incentive stock options or five years for other awards after disability or retirement. Awards are non-transferable except by disposition on death or to certain family members, trusts and other family entities as the Committee may approve. Awards may be paid in cash, shares of our Common Stock or a combination, in lump sum or installments and currently or by deferred payment, all as determined by the Committee.
As of April 30, 2017, and for all periods presented, our share-based awards under this plan have consisted of restricted stock grants, PSUs and stock option grants, none of which can be settled through cash payments, and Performance Share Awards. Both our stock options and restricted stock awards are subject only to vesting requirements based on continued employment at the end of a specified time period and typically vest in annual increments over three to four years or earlier upon death, disability or a change of control. However, our annual restricted stock awards issued prior to December 15, 2013 also vest upon attainment of age 65 and, only in the case of certain special one-time restricted stock awards, a portion vest on termination without cause or for good reason, as defined by the agreements governing such awards. Restricted stock awards issued after December 15, 2013 do not vest upon attainment of age 65, as provided by the agreements governing such awards. The vesting of our Performance Share Awards is described below.
11
Our time-based restricted stock awards are typically subject to graded vesting over a service period, which is typically three or four years. Our performance-based and market-based restricted stock awards are typically subject to cliff vesting at the end of the service period, which is typically three years. We recognize compensation cost for these awards on a straight-line basis over the requisite service period for each annual award grant. In the case of performance-based awards, expense is recognized based upon management’s assessment of the probability that such performance conditions will be achieved. Certain of our awards provide for accelerated vesting upon qualified retirement, after a change of control or upon termination without cause or for good reason. We recognize compensation cost for such awards over the period from grant date to the date the employee first becomes eligible for retirement.
Stock option awards
During the six month periods ended April 30, 2017 and May 1, 2016, we granted 10,424 and 28,535 stock options, respectively. The grant date fair value of options granted during the six month periods ended April 30, 2017 and May 1, 2016 was $6.59 and $5.38, respectively. There were 0.1 million options with an intrinsic value of $1.1 million exercised during the six months ended April 30, 2017, respectively. Cash received from the option exercises was $1.2 million.
Restricted stock and performance awards
Long-term incentive awards granted to our senior executives generally have a three-year performance period. Long-term incentive awards include restricted stock units and PSUs representing 40% and 60% of the total value, respectively. The restricted stock units vest upon continued employment. Vesting of the PSUs is contingent upon continued employment and the achievement of targets with respect to the following metrics, as defined by management: (1) cumulative free cash flow (weighted 40%); (2) cumulative earnings per share (weighted 40%); and (3) total shareholder return (weighted 20%), in each case during the performance period. At the end of the performance period, the number of actual shares to be awarded varies between 0% and 200% of target amounts. The PSUs vest pro rata if an executive’s employment terminates prior to the end of the performance period due to death, disability, or termination by the Company without cause or by the executive for good reason. If an executive’s employment terminates for any other reason prior to the end of the performance period, all outstanding unvested PSUs, whether earned or unearned, will be forfeited and cancelled. If a change in control occurs prior to the end of the performance period, the PSU payout will be calculated and paid assuming that the maximum benefit had been achieved. If an executive’s employment terminates due to death or disability while any of the restricted stock is unvested, then all of the unvested restricted stock will become vested. If an executive’s employment is terminated by the Company without cause or after reaching normal retirement age, the unvested restricted stock will be forfeited. If a change in control occurs prior to the end of the performance period, the restricted stock will fully vest. The fair value of the awards is based on the Company’s stock price as of the date of grant. During the six month periods ended April 30, 2017 and May 1, 2016, we granted PSUs with a total fair value of approximately $4.6 million and $5.2 million, respectively, to the Company’s senior executives.
Performance Share Awards granted to our key employees are paid 50% in cash and 50% in stock. Vesting of Performance Share Awards is contingent upon continued employment and the achievement of free cash flow and earnings per share targets, as defined by management, over a three-year performance period. At the end of the performance period, the number of actual shares to be awarded varies between 0% and 150% of target amounts. However, a minimum of 50% of the awards will vest upon continued employment over the three-year period if the minimum targets are not met. The Performance Share Awards vest earlier upon death, disability or a change of control. A portion of the awards also vests upon termination without cause or after reaching normal retirement age prior to the vesting date, as defined by the agreements governing such awards. The fair value of Performance Share Awards is based on the Company’s stock price as of the date of grant. During the six months ended April 30, 2017 and May 1, 2016, we granted awards to key employees with equity fair values of $2.0 million and $2.4 million and cash values of $2.0 million and $2.1 million, respectively.
On December 15, 2016, the performance period ended for certain PSUs granted to senior executives in December 2014 and the Performance Share Awards granted to key employees in December 2013. The PSUs vested at 149.3%, and resulted in the issuance of 0.1 million shares, net of shares withheld for taxes. The Performance Share Awards vested at 50.0%, and resulted in the issuance of less than 0.1 million shares, net of shares withheld for taxes.
For the restricted stock units granted in December 2016 and 2015 to our senior executives, one-third vests annually. The restricted stock units granted in December 2014 to our senior executives vested two-thirds on December 15, 2016 and the remaining one-third vests on December 15, 2017. The PSUs granted in December 2016 and 2015 to our senior executives cliff vest at the end of the respective three-year performance period. The PSUs granted in December 2014 to our senior executives vested one-half on December 15, 2016 and the remaining one-half vests on December 15, 2017. During the six months ended April 30, 2017 and May 1, 2016, we granted time-based restricted stock units with a fair value of $4.0 million, representing 0.3 million shares, and $3.9 million, representing 0.3 million shares, respectively.
During the six month periods ended April 30, 2017 and May 1, 2016, we recorded share-based compensation expense for all awards of $5.9 million and $5.1 million, respectively.
12
Deferred Compensation
In accordance with the Company’s Deferred Compensation Plan, amounts deferred into the Company Stock Fund must remain invested in the Company Stock Fund until distribution. The deferred compensation obligation related to the Company’s stock may only be settled by the delivery of a fixed number of the Company’s common shares held on the participant’s behalf. As a result, we have a deferred compensation obligation of $1.2 million related to the Company Stock Fund that is recorded within equity in additional paid-in capital on the consolidated balance sheet as of April 30, 2017. Subsequent changes in the fair value of the deferred compensation obligation classified within equity are not recognized. Additionally, the Company currently holds 164,663 shares in treasury shares, relating to deferred, vested PSU awards, until participants are eligible to receive benefits under the terms of the Deferred Compensation Plan.
NOTE 8 — EARNINGS PER COMMON SHARE
Basic earnings per common share is computed by dividing net income allocated to common shares by the weighted average number of common shares outstanding. Diluted earnings per common share, if applicable, considers the dilutive effect of common stock equivalents. The reconciliation of the numerator and denominator used for the computation of basic and diluted earnings per common share is as follows (in thousands, except per share data):
Fiscal Three Months Ended | Fiscal Six Months Ended | ||||||||||||||
April 30, 2017 | May 1, 2016 | April 30, 2017 | May 1, 2016 | ||||||||||||
Numerator for Basic and Diluted Earnings Per Common Share: | |||||||||||||||
Net income applicable to common shares | $ | 16,859 | $ | 2,397 | $ | 18,882 | $ | 8,233 | |||||||
Denominator for Basic and Diluted Earnings Per Common Share: | |||||||||||||||
Weighted average basic number of common shares outstanding | 70,988 | 72,352 | 70,933 | 72,806 | |||||||||||
Common stock equivalents: | |||||||||||||||
Employee stock options | 134 | 534 | 138 | 515 | |||||||||||
PSUs and Performance Share Awards | — | — | 36 | — | |||||||||||
Weighted average diluted number of common shares outstanding | 71,122 | 72,886 | 71,107 | 73,321 | |||||||||||
Basic earnings per common share | $ | 0.24 | $ | 0.03 | $ | 0.27 | $ | 0.11 | |||||||
Diluted earnings per common share | $ | 0.24 | $ | 0.03 | $ | 0.27 | $ | 0.11 | |||||||
Incentive Plan securities excluded from dilution(1) | 2 | 24 | 2 | 6 | |||||||||||
(1) | Represents securities not included in the computation of diluted earnings per common share because their effect would have been anti-dilutive. |
We calculate earnings per share using the “two-class” method, whereby unvested share-based payment awards that contain nonforfeitable rights to dividends or dividend equivalents are “participating securities” and, therefore, these participating securities are treated as a separate class in computing earnings per share. The calculation of earnings per share presented here excludes the income attributable to unvested restricted stock units related to our Incentive Plan from the numerator and excludes the dilutive impact of those shares from the denominator. Awards subject to the achievement of performance conditions or market conditions for which such conditions had been met at the end of any of the fiscal periods presented are included in the computation of diluted earnings per common share if their effect was dilutive.
NOTE 9 — WARRANTY
We sell weathertightness warranties to our customers for protection from leaks in our roofing systems related to weather. These warranties generally range from 2 years to 20 years. We sell two types of warranties, standard and Single Source™, and three grades of coverage for each. The type and grade of coverage determines the price to the customer. For standard warranties, our responsibility for leaks in a roofing system begins after 24 consecutive leak-free months. For Single Source™ warranties, the roofing system must pass our inspection before warranty coverage will be issued. Inspections are typically performed at three stages of the roofing project: (i) at the project start-up; (ii) at the project mid-point; and (iii) at the project completion. These inspections are included in the cost of the warranty. If the project requires or the customer requests additional inspections, those
13
inspections are billed to the customer. Upon the sale of a warranty, we record the resulting revenue as deferred revenue, which is included in other accrued expenses on our consolidated balance sheets.
The following table represents the rollforward of our accrued warranty obligation and deferred warranty revenue activity for each of the fiscal six months ended (in thousands):
Fiscal Six Months Ended | |||||||
April 30, 2017 | May 1, 2016 | ||||||
Beginning balance | $ | 27,200 | $ | 25,669 | |||
Warranties sold | 1,234 | 1,217 | |||||
Revenue recognized | (1,512 | ) | (1,421 | ) | |||
Ending balance | $ | 26,922 | $ | 25,465 | |||
NOTE 10 — DEFINED BENEFIT PLANS
RCC Pension Plan — With the acquisition of Robertson-Ceco II Corporation (“RCC”) on April 7, 2006, we assumed a defined benefit plan (the “RCC Pension Plan”). Benefits under the RCC Pension Plan are primarily based on years of service and the employee’s compensation. The RCC Pension Plan is frozen and, therefore, employees do not accrue additional service benefits. Plan assets of the RCC Pension Plan are invested in broadly diversified portfolios of government obligations, mutual funds, stocks, bonds, fixed income securities and master limited partnerships.
CENTRIA Benefit Plans — As a result of the CENTRIA Acquisition on January 16, 2015, we assumed noncontributory defined benefit plans covering certain hourly employees (the “CENTRIA Benefit Plans”) and are closed to new participants. Benefits under the CENTRIA Benefit Plans are calculated based on fixed amounts for each year of service rendered, although benefits accruals for one of the plans previously ceased. Plan assets of the CENTRIA Benefit Plans are invested in broadly diversified portfolios of domestic and international equity mutual funds, bonds, mortgages and other funds. CENTRIA also sponsors postretirement medical and life insurance plans that cover certain of its employees and their spouses (the “OPEB Plans”).
In addition to the CENTRIA Benefit Plans, CENTRIA contributes to a multi-employer plan, Steelworkers Pension Trust. The minimum required annual contribution to this plan is $0.3 million. The current contract expires on June 1, 2019. If we were to withdraw our participation from this multi-employer plan, CENTRIA may be required to pay a withdrawal liability representing an amount based on the underfunded status of the plan. The plan is not significant to the Company’s consolidated financial statements.
We refer to the RCC Pension Plan and the CENTRIA Benefit Plans collectively as the “Defined Benefit Plans” in this Note.
The following table sets forth the components of the net periodic benefit cost, before tax, and funding contributions, for the periods indicated (in thousands):
Fiscal Three Months Ended April 30, 2017 | Fiscal Three Months Ended May 1, 2016 | ||||||||||||||||||||||
Defined Benefit Plans | OPEB Plans | Total | Defined Benefit Plans | OPEB Plans | Total | ||||||||||||||||||
Service cost | $ | 24 | $ | 9 | $ | 33 | $ | 34 | $ | 8 | $ | 42 | |||||||||||
Interest cost | 513 | 64 | 577 | 589 | 65 | 654 | |||||||||||||||||
Expected return on assets | (700 | ) | — | (700 | ) | (745 | ) | — | (745 | ) | |||||||||||||
Amortization of prior service credit | (2 | ) | — | (2 | ) | (2 | ) | — | (2 | ) | |||||||||||||
Amortization of net actuarial loss | 344 | — | 344 | 292 | — | 292 | |||||||||||||||||
Net periodic benefit cost | $ | 179 | $ | 73 | $ | 252 | $ | 168 | $ | 73 | $ | 241 | |||||||||||
Funding contributions | $ | 591 | $ | — | $ | 591 | $ | 394 | $ | — | $ | 394 | |||||||||||
14
Fiscal Six Months Ended April 30, 2017 | Fiscal Six Months Ended May 1, 2016 | ||||||||||||||||||||||
Defined Benefit Plans | OPEB Plans | Total | Defined Benefit Plans | OPEB Plans | Total | ||||||||||||||||||
Service cost | $ | 49 | $ | 18 | $ | 67 | $ | 68 | $ | 17 | $ | 85 | |||||||||||
Interest cost | 1,027 | 129 | 1,156 | 1,178 | 131 | 1,309 | |||||||||||||||||
Expected return on assets | (1,399 | ) | — | (1,399 | ) | (1,489 | ) | — | (1,489 | ) | |||||||||||||
Amortization of prior service credit | (5 | ) | — | (5 | ) | (5 | ) | — | (5 | ) | |||||||||||||
Amortization of net actuarial loss | 687 | — | 687 | 585 | — | 585 | |||||||||||||||||
Net periodic benefit cost | $ | 359 | $ | 147 | $ | 506 | $ | 337 | $ | 148 | $ | 485 | |||||||||||
Funding contributions | $ | 825 | $ | — | $ | 825 | $ | 765 | $ | — | $ | 765 | |||||||||||
We expect to contribute an additional $1.1 million to the Defined Benefit Plans for the remainder of fiscal 2017. Our policy is to fund the CENTRIA Benefit Plans as required by minimum funding standards of the Internal Revenue Code. The contributions to the OPEB Plans by retirees vary from none to 25% of the total premiums paid.
NOTE 11 — LONG-TERM DEBT AND NOTE PAYABLE
Debt is comprised of the following (in thousands):
April 30, 2017 | October 30, 2016 | ||||||
Credit Agreement, due June 2019 (variable interest, at 4.25% on April 30, 2017 and on October 30, 2016) | $ | 144,147 | $ | 154,147 | |||
8.25% senior notes, due January 2023 | 250,000 | 250,000 | |||||
Amended Asset-Based lending facility, due June 2019 (variable interest, at our option as described below) | — | — | |||||
Less: unamortized deferred financing costs(1) | 7,341 | 8,096 | |||||
Total long-term debt, net of deferred financing costs | $ | 386,806 | $ | 396,051 | |||
(1) | Includes the unamortized deferred financing costs associated with the Notes and Credit Agreement. The unamortized deferred financing costs associated with the Amended ABL Facility of $0.9 million and $1.1 million as of April 30, 2017 and October 30, 2016, respectively, are classified in other assets on the consolidated balance sheets. |
8.25% Senior Notes Due January 2023
The Company’s $250.0 million in aggregate principal amount of 8.25% senior notes due 2023 (the “Notes”) bear interest at 8.25% per annum and will mature on January 15, 2023. Interest is payable semi-annually in arrears on January 15 and July 15 of each year.
The Company may redeem the Notes at any time prior to January 15, 2018, at a price equal to 100% of the principal amount thereof, plus accrued and unpaid interest, if any, to the redemption date, plus the applicable make-whole premium. On or after January 15, 2018, the Company may redeem all or a part of the Notes at redemption prices (expressed as percentages of principal amount thereof) set forth below, plus accrued and unpaid interest, if any, to the applicable redemption date of the Notes, if redeemed during the 12-month period beginning on January 15 of the year as follows:
Year | Percentage | |
2018 | 106.188% | |
2019 | 104.125% | |
2020 | 102.063% | |
2021 and thereafter | 100.000% | |
In addition, prior to January 15, 2018, the Company may redeem the Notes in an aggregate principal amount of up to 40.0% of the original aggregate principal amount of the Notes with funds in an equal aggregate amount not exceeding the aggregate proceeds of one or more equity offerings, at a redemption price of 108.250%, plus accrued and unpaid interest, if any, to the applicable redemption date of the Notes.
15
Credit Agreement
The Company’s Credit Agreement provided for a term loan credit facility (“Term Loan”) in an original aggregate principal amount of $250.0 million. The Credit Agreement will mature on June 24, 2019. The Term Loan amortizes in nominal quarterly installments equal to one percent of the aggregate initial principal amount thereof per annum. The Term Loan bears interest at a floating rate measured by reference to, at the Company’s option, either (i) an adjusted LIBOR not less than 1.00% plus a borrowing margin of 3.25% per annum or (ii) an alternate base rate plus a borrowing margin of 2.25% per annum. At both April 30, 2017 and October 30, 2016, the interest rate on the Term Loan was 4.25%.
During the six month periods ended April 30, 2017 and May 1, 2016, the Company made voluntary prepayments of $10.0 million and $20.0 million, respectively, on the outstanding principal amount of the Term Loan.
On May 2, 2017, the Company entered into Amendment No. 2 (the “Amendment”) to the Credit Agreement. For additional information on the Amendment, see Note 18 — Subsequent Events.
Amended ABL Facility
The Company’s Asset-Based Lending Facility (“Amended ABL Facility”) provides for revolving loans of up to $150.0 million (subject to a borrowing base) and letters of credit of up to $30.0 million. Borrowing availability under the Amended ABL Facility is determined by a monthly borrowing base collateral calculation that is based on specified percentages of the value of qualified cash, eligible inventory and eligible accounts receivable, less certain reserves and subject to certain other adjustments. At April 30, 2017 and October 30, 2016, the Company’s excess availability under the Amended ABL Facility was $139.9 million and $140.9 million, respectively. At both April 30, 2017 and October 30, 2016, the Company had no revolving loans outstanding under the Amended ABL Facility. In addition, at April 30, 2017 and October 30, 2016, standby letters of credit related to certain insurance policies totaling approximately $10.0 million and $9.1 million, respectively, were outstanding but undrawn under the Amended ABL Facility. The Amended ABL Facility will mature on June 24, 2019.
The Amended ABL Facility includes a minimum fixed charge coverage ratio of 1.00:1.00, which will apply if we fail to maintain a specified minimum borrowing capacity. The minimum level of borrowing capacity as of April 30, 2017 and October 30, 2016 was $21.0 million and $21.1 million, respectively. Although the Amended ABL Facility did not require any financial covenant compliance, at April 30, 2017 and October 30, 2016, NCI’s fixed charge coverage ratio, which is calculated on a trailing twelve month basis, was 3.43:1.00 and 2.86:1.00, respectively.
Loans under the Amended ABL Facility bear interest, at NCI’s option, as follows:
(1) | Base Rate loans at the Base Rate plus a margin. The margin ranges from 0.75% to 1.25% depending on the quarterly average excess availability under such facility, and |
(2) | LIBOR loans at LIBOR plus a margin. The margin ranges from 1.75% to 2.25% depending on the quarterly average excess availability under such facility. |
An unused commitment fee is paid monthly on the Amended ABL Facility at an annual rate of 0.50% based on the amount by which the maximum credit exceeds the average daily principal balance of outstanding loans and letter of credit obligations. Additional customary fees in connection with the Amended ABL Facility also apply.
For additional information on the Notes, Credit Agreement and the Amended ABL Facility, including guarantees and security, see our Annual Report on Form 10-K for the fiscal year ended October 30, 2016.
Debt Covenants
The Company’s outstanding debt agreements contain a number of covenants that, among other things, limit or restrict the ability of the Company and its subsidiaries to dispose of assets, make acquisitions and engage in mergers. As of April 30, 2017, the Company was in compliance with all covenants that were in effect on such date.
Insurance Note Payable
As of April 30, 2017 and October 30, 2016, the Company had an outstanding note payable in the amount of $1.4 million and $0.5 million, respectively, related to financed insurance premiums. Insurance premium financings are generally secured by the unearned premiums under such policies.
16
NOTE 12 — CD&R FUNDS
On August 14, 2009, the Company entered into an Investment Agreement (as amended, the “Investment Agreement”), by and between the Company and Clayton, Dubilier & Rice Fund VIII, L.P. (“CD&R Fund VIII”). In connection with the Investment Agreement and the Stockholders Agreement dated October 20, 2009 (the “Stockholders Agreement”), the CD&R Fund VIII and the Clayton, Dubilier & Rice Friends & Family Fund VIII, L.P. (collectively, the “CD&R Funds”) purchased convertible preferred stock, which was converted into shares of our common stock on May 14, 2013. Among other provisions, the Stockholders Agreement entitles the CD&R Funds to certain nomination or designation rights with respect to our board of directors; subscription rights with respect to future issuances of common stock by us; corporate governance rights; and consent rights with respect to certain types of transactions we may enter into in the future.
At April 30, 2017 and October 30, 2016, the CD&R Funds owned approximately 42.3% and 42.3%, respectively, of the outstanding shares of our common stock.
NOTE 13 — STOCK REPURCHASE PROGRAM
On September 8, 2016, the Company’s Board of Directors authorized a stock repurchase program for the repurchase of up to an aggregate of $50.0 million of the Company’s outstanding common stock. Under this repurchase program, the Company is authorized to repurchase shares, if at all, at times and in amounts that it deems appropriate in accordance with all applicable securities laws and regulations. Shares repurchased are usually retired. There is no time limit on the duration of the program.
During the six months ended April 30, 2017, the Company repurchased approximately 0.2 million shares for $3.5 million under the stock repurchase program. At April 30, 2017, approximately $39.9 million remained available for stock repurchases under the program. The timing and method of any repurchases, which will depend on a variety of factors, including market conditions, are subject to results of operations, financial conditions, cash requirements and other factors, and may be suspended or discontinued at any time.
In addition to the common stock repurchased during the six months ended April 30, 2017, the Company also withheld shares of stock to satisfy minimum tax withholding obligations arising in connection with the vesting of stock awards, which are included in treasury stock purchases in the consolidated statements of stockholders’ equity.
NOTE 14 — FAIR VALUE OF FINANCIAL INSTRUMENTS AND FAIR VALUE MEASUREMENTS
Fair Value of Financial Instruments
The carrying amounts of cash and cash equivalents, restricted cash, trade accounts receivable, accounts payable and notes payable approximate fair value as of April 30, 2017 and October 30, 2016 because of their relatively short maturities. The fair values of the remaining financial instruments not currently recognized at fair value on our consolidated balance sheets at the respective fiscal period ends were (in thousands):
April 30, 2017 | October 30, 2016 | ||||||||||||||
Carrying Amount | Fair Value | Carrying Amount | Fair Value | ||||||||||||
Credit Agreement, due June 2019 | $ | 144,147 | $ | 144,507 | $ | 154,147 | $ | 154,147 | |||||||
8.25% senior notes, due January 2023 | 250,000 | 270,625 | 250,000 | 272,500 | |||||||||||
The fair values of the Credit Agreement and the Notes were based on recent trading activities of comparable market instruments, which are level 2 inputs.
Fair Value Measurements
ASC Subtopic 820-10, Fair Value Measurements and Disclosures, requires us to use valuation techniques to measure fair value that maximize the use of observable inputs and minimize the use of unobservable inputs. These inputs are prioritized as follows:
Level 1: Observable inputs such as quoted prices for identical assets or liabilities in active markets.
Level 2: Other inputs that are observable directly or indirectly, such as quoted prices for similar assets or liabilities or market-corroborated inputs.
Level 3: Unobservable inputs for which there is little or no market data and which require us to develop our own assumptions about how market participants would price the assets or liabilities.
The following is a description of the valuation methodologies used for assets and liabilities measured at fair value. There have been no changes in the methodologies used at April 30, 2017 and October 30, 2016.
17
Money market: Money market funds have original maturities of three months or less. The original cost of these assets approximates fair value due to their short-term maturity.
Mutual funds: Mutual funds are valued at the closing price reported in the active market in which the mutual fund is traded.
Assets held for sale: Assets held for sale are valued based on current market conditions, prices of similar assets in similar condition and expected proceeds from the sale of the assets, representative of Level 3 inputs.
Deferred compensation plan liability: Deferred compensation plan liability is comprised of phantom investments in the deferred compensation plan and is valued at the closing price reported in the active markets in which the money market and mutual funds are traded.
The following tables summarize information regarding our financial assets and liabilities that are measured at fair value on a recurring basis as of April 30, 2017 and October 30, 2016, segregated by the level of the valuation inputs within the fair value hierarchy utilized to measure fair value (in thousands):
April 30, 2017 | |||||||||||||||
Level 1 | Level 2 | Level 3 | Total | ||||||||||||
Assets: | |||||||||||||||
Short-term investments in deferred compensation plan:(1) | |||||||||||||||
Money market | $ | 1,489 | $ | — | $ | — | $ | 1,489 | |||||||
Mutual funds – Growth | 873 | — | — | 873 | |||||||||||
Mutual funds – Blend | 1,782 | — | — | 1,782 | |||||||||||
Mutual funds – Foreign blend | 803 | — | — | 803 | |||||||||||
Mutual funds – Fixed income | — | 1,522 | — | 1,522 | |||||||||||
Total short-term investments in deferred compensation plan | 4,947 | 1,522 | — | 6,469 | |||||||||||
Total assets | $ | 4,947 | $ | 1,522 | $ | — | $ | 6,469 | |||||||
Liabilities: | |||||||||||||||
Deferred compensation plan liability | $ | — | $ | 4,490 | $ | — | $ | 4,490 | |||||||
Total liabilities | $ | — | $ | 4,490 | $ | — | $ | 4,490 | |||||||
October 30, 2016 | |||||||||||||||
Level 1 | Level 2 | Level 3 | Total | ||||||||||||
Assets: | |||||||||||||||
Short-term investments in deferred compensation plan:(1) | |||||||||||||||
Money market | $ | 422 | $ | — | $ | — | $ | 422 | |||||||
Mutual funds – Growth | 773 | — | — | 773 | |||||||||||
Mutual funds – Blend | 3,118 | — | — | 3,118 | |||||||||||
Mutual funds – Foreign blend | 730 | — | — | 730 | |||||||||||
Mutual funds – Fixed income | — | 705 | — | 705 | |||||||||||
Total short-term investments in deferred compensation plan | 5,043 | 705 | — | 5,748 | |||||||||||
Total assets | $ | 5,043 | $ | 705 | $ | — | $ | 5,748 | |||||||
Liabilities: | |||||||||||||||
Deferred compensation plan liability | $ | — | $ | 3,847 | $ | — | $ | 3,847 | |||||||
Total liabilities | $ | — | $ | 3,847 | $ | — | $ | 3,847 | |||||||
(1) | Unrealized holding gain (loss) for the three months ended April 30, 2017 and May 1, 2016 was $0.2 million and $0.3 million, respectively. Unrealized holding gain (loss) for the six months ended April 30, 2017 and May 1, 2016 was $(0.3) million and $(0.1) million, respectively. The net unrealized holding gain was insignificant for the fiscal year ended October 30, 2016. These unrealized holding gains (losses) were substantially offset by changes in the deferred compensation plan liability. |
18
The following table summarizes information regarding our financial assets that are measured at fair value on a nonrecurring basis as of April 30, 2017, segregated by level of the valuation inputs within the fair value hierarchy utilized to measure fair value (in thousands):
Level 1 | Level 2 | Level 3 | Total | ||||||||||||
Assets: | |||||||||||||||
Assets held for sale(2) | $ | — | $ | — | $ | 499 | $ | 499 | |||||||
Total assets | $ | — | $ | — | $ | 499 | $ | 499 | |||||||
(2) | Certain assets held for sale are valued at fair value and are measured at fair value on a nonrecurring basis. Assets held for sale are reported at fair value, if, on an individual basis, the fair value of the asset is less than cost. The fair value of assets held for sale is estimated using Level 3 inputs, such as broker quotes for like-kind assets or other market indications of a potential selling value that approximates fair value. |
NOTE 15 — INCOME TAXES
The effective tax rate for the six months ended April 30, 2017 was 34.2%, compared to 30.6% for the same period in the prior year. The change in the effective tax rate was primarily driven by a one-time adjustment in the first quarter of fiscal 2016 related to the research and development credit for fiscal 2015 that was permanently extended in the Protecting Americans from Tax Hikes Act of 2015 and was signed into law in fiscal 2016 as well as the nontaxable gain on bargain purchase from the Hamilton acquisition. There were no corresponding items in the six months ended April 30, 2017.
NOTE 16 — OPERATING SEGMENTS
Operating segments are defined as components of an enterprise that engage in business activities and by which discrete financial information is available that is evaluated on a regular basis by the chief operating decision maker to make decisions about how to allocate resources to the segment and assess the performance of the segment. We have three operating segments: engineered building systems; metal components; and metal coil coating. All operating segments operate primarily in the nonresidential construction market. Sales and earnings are influenced by general economic conditions, the level of nonresidential construction activity, metal roof repair and retrofit demand and the availability and terms of financing available for construction. Products of our operating segments use similar basic raw materials. The metal coil coating segment consists of cleaning, treating, painting and slitting continuous steel coils before the steel is fabricated for use by construction and industrial users. The metal components segment products include metal roof and wall panels, doors, metal partitions, metal trim, insulated panels and other related accessories. The engineered building systems segment includes the manufacturing of main frames, Long Bay® Systems and value-added engineering and drafting, which are typically not part of metal components or metal coil coating products or services. The operating segments follow the same accounting policies used for our consolidated financial statements.
We evaluate a segment’s performance based primarily upon operating income before corporate expenses. Intersegment sales are recorded based on standard material costs plus a standard markup to cover labor and overhead and consist of (i) hot-rolled, light gauge painted and slit material and other services provided by the metal coil coating segment to both the metal components and engineered building systems segments; (ii) building components provided by the metal components segment to the engineered building systems segment; and (iii) structural framing provided by the engineered building systems segment to the metal components segment.
Corporate assets consist primarily of cash, but also include deferred taxes and property, plant and equipment associated with our headquarters in Houston, Texas. These items (and income and expenses related to these items) are not allocated to the operating segments. Corporate unallocated expenses include share-based compensation expenses, and executive, legal, finance, tax, treasury, human resources, information technology, purchasing, marketing and corporate travel expenses. Additional unallocated amounts primarily include interest income, interest expense and other (expense) income.
19
The following table represents summary financial data attributable to these operating segments for the periods indicated (in thousands):
Fiscal Three Months Ended | Fiscal Six Months Ended | ||||||||||||||
April 30, 2017 | May 1, 2016 | April 30, 2017 | May 1, 2016 | ||||||||||||
Total sales: | |||||||||||||||
Engineered building systems | $ | 162,624 | $ | 138,023 | $ | 313,887 | $ | 286,998 | |||||||
Metal components | 270,621 | 234,637 | 515,922 | 464,303 | |||||||||||
Metal coil coating | 63,317 | 55,178 | 127,519 | 106,383 | |||||||||||
Intersegment sales | (76,098 | ) | (55,591 | ) | (145,161 | ) | (115,423 | ) | |||||||
Total sales | $ | 420,464 | $ | 372,247 | $ | 812,167 | $ | 742,261 | |||||||
External sales: | |||||||||||||||
Engineered building systems | $ | 154,456 | $ | 134,454 | $ | 299,477 | $ | 280,405 | |||||||
Metal components | 239,576 | 211,661 | 458,535 | 414,562 | |||||||||||
Metal coil coating | 26,432 | 26,132 | 54,155 | 47,294 | |||||||||||
Total sales | $ | 420,464 | $ | 372,247 | $ | 812,167 | $ | 742,261 | |||||||
Operating income (loss): | |||||||||||||||
Engineered building systems | $ | 6,894 | $ | 7,193 | $ | 13,398 | $ | 19,655 | |||||||
Metal components | 40,087 | 17,835 | 56,117 | 33,938 | |||||||||||
Metal coil coating | 5,514 | 4,704 | 10,758 | 9,525 | |||||||||||
Corporate | (20,023 | ) | (19,138 | ) | (37,915 | ) | (37,265 | ) | |||||||
Total operating income | $ | 32,472 | $ | 10,594 | $ | 42,358 | $ | 25,853 | |||||||
Unallocated other expense, net | (6,892 | ) | (6,965 | ) | (13,463 | ) | (13,879 | ) | |||||||
Income before income taxes | $ | 25,580 | $ | 3,629 | $ | 28,895 | $ | 11,974 | |||||||
April 30, 2017 | October 30, 2016 | ||||||
Total assets: | |||||||
Engineered building systems | $ | 219,896 | $ | 229,422 | |||
Metal components | 661,978 | 654,534 | |||||
Metal coil coating | 82,179 | 87,194 | |||||
Corporate | 59,760 | 79,050 | |||||
Total assets | $ | 1,023,813 | $ | 1,050,200 | |||
NOTE 17 — CONTINGENCIES
As a manufacturer of products primarily for use in nonresidential building construction, the Company is inherently exposed to various types of contingent claims, both asserted and unasserted, in the ordinary course of business. As a result, from time to time, the Company and/or its subsidiaries become involved in various legal proceedings or other contingent matters arising from claims, or potential claims. The Company insures against these risks to the extent deemed prudent by its management and to the extent insurance is available. Many of these insurance policies contain deductibles or self-insured retentions in amounts the Company deems prudent and for which the Company is responsible for payment. In determining the amount of self-insurance, it is the Company’s policy to self-insure those losses that are predictable, measurable and recurring in nature, such as claims for automobile liability and general liability. The Company regularly reviews the status of ongoing proceedings and other contingent matters along with legal counsel. Liabilities for such items are recorded when it is probable that the liability has been incurred and when the amount of the liability can be reasonably estimated. Liabilities are adjusted when additional information becomes available. Management believes that the ultimate disposition of these matters will not have a material adverse effect on the Company’s results of operations, financial position or cash flows. However, such matters are subject to many uncertainties and outcomes are not predictable with assurance.
20
NOTE 18 — SUBSEQUENT EVENTS
On May 2, 2017, the Company entered into Amendment No. 2 (the “Amendment”) to its existing Credit Agreement, dated as of June 22, 2012, between NCI Building Systems, Inc., as borrower, and Credit Suisse AG, Cayman Islands Branch, as administrative agent and collateral agent and the other financial institutions party thereto from time to time (as previously amended by Amendment No. 1, dated as of June 24, 2013, the “Existing Term Loan Facility” and, as amended, the “Term Loan Facility”)), primarily to extend the maturity date and reduce the interest rate applicable to all of the outstanding term loans under the Term Loan Facility.
Prior to the Amendment, approximately $144.1 million of term loans (the “Existing Term Loans”) were outstanding under the Existing Term Loan Facility. Pursuant to the Amendment, certain lenders under the Existing Term Loan Facility extended their Existing Term Loans, in an aggregate amount, along with new term loans advanced by certain new lenders of approximately $144.1 million (the “New Term Loans”). The proceeds of the New Term Loans advanced by the new lenders were used to prepay in full all of the Existing Term Loans that were not extended as New Term Loans. Pursuant to the Amendment, the maturity date of the New Term Loans was extended to June 24, 2022.
Pursuant to the Amendment, the New Term Loans will bear interest at a floating rate measured by reference to, at the Company’s option, either (i) an adjusted LIBOR not less than 1.00% plus a borrowing margin of 3.00% per annum or (ii) an alternative base rate plus a borrowing margin of 2.00% per annum.
The New Term Loans will be secured by the same collateral and guaranteed by the same guarantors as the Existing Term Loans under the Existing Term Loan Facility. Voluntary prepayments of the New Term Loans are permitted at any time, in minimum principal amounts, without premium or penalty, subject to a 1.00% premium payable in connection with certain repricing transactions within the first six months. The Amendment also includes certain other changes to the Term Loan Facility.
21
NCI BUILDING SYSTEMS, INC.
Item 2. Management’s Discussion and Analysis of Financial Condition and Results of Operations.
The following information should be read in conjunction with the unaudited consolidated financial statements included herein under “Item 1. Unaudited Consolidated Financial Statements” and the audited consolidated financial statements and the notes thereto and “Item 7. Management’s Discussion and Analysis of Financial Condition and Results of Operations” included in our Annual Report on Form 10-K for the fiscal year ended October 30, 2016.
FORWARD LOOKING STATEMENTS
This Quarterly Report includes statements concerning our expectations, beliefs, plans, objectives, goals, strategies, future events or performance and underlying assumptions and other statements that are not historical facts. These statements are “forward-looking statements” within the meaning of the Private Securities Litigation Reform Act of 1995. Actual results may differ materially from those expressed or implied by these statements. In some cases, our forward-looking statements can be identified by the words “anticipate,” “believe,” “continue,” “could,” “estimate,” “expect,” “forecast,” “goal,” “intend,” “may,” “objective,” “plan,” “potential,” “predict,” “projection,” “should,” “will” or other similar words. We have based our forward-looking statements on our management’s beliefs and assumptions based on information available to our management at the time the statements are made. We caution you that assumptions, beliefs, expectations, intentions and projections about future events may and often do vary materially from actual results. Therefore, we cannot assure you that actual results will not differ materially from those expressed or implied by our forward-looking statements. Accordingly, investors are cautioned not to place undue reliance on any forward-looking information, including any earnings guidance, if applicable. Although we believe that the expectations reflected in the forward-looking statements are reasonable, these expectations and the related statements are subject to risks, uncertainties, and other factors that could cause the actual results to differ materially from those projected. These risks, uncertainties, and other factors include, but are not limited to:
• | industry cyclicality and seasonality and adverse weather conditions; |
• | challenging economic conditions affecting the nonresidential construction industry; |
• | volatility in the United States (“U.S.”) economy and abroad, generally, and in the credit markets; |
• | substantial indebtedness and our ability to incur substantially more indebtedness; |
• | our ability to generate significant cash flow required to service or refinance our existing debt, including the 8.25% senior notes due 2023, and obtain future financing; |
• | our ability to comply with the financial tests and covenants in our existing and future debt obligations; |
• | operational limitations or restrictions in connection with our debt; |
• | increases in interest rates; |
• | recognition of asset impairment charges; |
• | commodity price increases and/or limited availability of raw materials, including steel; |
• | our ability to make strategic acquisitions accretive to earnings; |
• | retention and replacement of key personnel; |
• | our ability to carry out our restructuring plans and to fully realize the expected cost savings; |
• | enforcement and obsolescence of intellectual property rights; |
• | fluctuations in customer demand; |
• | costs related to environmental clean-ups and liabilities; |
• | competitive activity and pricing pressure; |
• | increases in energy prices; |
• | volatility of the Company’s stock price; |
• | dilutive effect on the Company’s common stockholders of potential future sales of the Company’s Common Stock held by our sponsor; |
• | substantial governance and other rights held by our sponsor; |
22
• | breaches of our information system security measures and damage to our major information management systems; |
• | hazards that may cause personal injury or property damage, thereby subjecting us to liabilities and possible losses, which may not be covered by insurance; |
• | changes in laws or regulations, including the Dodd–Frank Act; |
• | costs and other effects of legal and administrative proceedings, settlements, investigations, claims and other matters; |
• | timing and amount of any stock repurchases; and |
• | other risks detailed under the caption “Risk Factors” in Part I, Item 1A in our most recent Annual Report on Form 10-K as filed with the SEC. |
A forward-looking statement may include a statement of the assumptions or bases underlying the forward-looking statement. We believe that we have chosen these assumptions or bases in good faith and that they are reasonable. However, we caution you that assumed facts or bases almost always vary from actual results, and the differences between assumed facts or bases and actual results can be material, depending on the circumstances. When considering forward-looking statements, you should keep in mind the risk factors and other cautionary statements in this report, including those described under the caption “Risk Factors” in our most recent Annual Report on Form 10-K as filed with the SEC and other risks described in documents subsequently filed by the Company from time to time with the SEC. We expressly disclaim any obligations to release publicly any updates or revisions to these forward-looking statements to reflect any changes in our expectations unless the securities laws require us to do so.
OVERVIEW
NCI Building Systems, Inc. (together with its subsidiaries, unless the context requires otherwise, the “Company,” “NCI,” “we,” “us” or “our”) is one of North America’s largest integrated manufacturers and marketers of metal products for the nonresidential construction industry. We design, engineer, manufacture and market engineered building systems and metal components primarily for nonresidential construction use. We manufacture and distribute extensive lines of metal products for the nonresidential construction market under multiple brand names through a nationwide network of plants and distribution centers. We sell our products for both new construction and repair and retrofit applications. We also provide metal coil coating services for commercial and construction applications, servicing both internal and external customers.
Engineered building systems offer a number of advantages over traditional construction alternatives, including shorter construction time, more efficient use of materials, lower construction costs, greater ease of expansion and lower maintenance costs. Similarly, metal components offer builders, designers, architects and end-users several advantages, including lower long-term costs, longer life, attractive aesthetics and design flexibility.
We use a 52/53 week year with our fiscal year end on the Sunday closest to October 31. In fiscal 2017, our year end will be October 29, 2017.
We assess performance across our operating segments by analyzing and evaluating, among other indicators, gross profit and operating income, as well as whether each segment has achieved its projected sales goals. In assessing our overall financial performance, we regard return on adjusted operating assets, as well as growth in earnings, as key indicators of shareholder value.
Second Fiscal Quarter
During the second quarter of fiscal 2017, the Company has continued to realize the benefits of focused and integrated execution across our commercial, manufacturing, and supply chain activities, and our investments to improve our manufacturing productivity and overall cost efficiency. We are also maintaining commercial pricing discipline in an environment of volatile steel prices. We remain focused on growing and integrating insulated metal panel products (“IMP”) into our building and components businesses, which had a favorable impact on our operating results for the second quarter of fiscal 2017. Overall, our operating results improved this period as compared to the first quarter of fiscal 2017 and the same period in the prior year in terms of revenue, net income, and Adjusted EBITDA.
Consolidated revenues increased by approximately 13% from the same period in the prior year. The year-over-year improvement was primarily driven by tonnage volume growth across all segments, as well as the pass-through of rising steel prices and more favorable sales mix. Revenue growth was consistent with the underlying increase in volumes.
The Company’s gross margin in the current period was in line with the gross margin in the prior period at 24.0%. We maintained our gross margin despite rising steel prices that increased our material costs. We also achieved operating leverage on higher volumes and remain focused on commercial discipline and manufacturing efficiencies. Engineering, selling, general and administrative expenses as a percentage of revenues decreased by 220 basis points to 17.9% of sales compared to the same period last year, as we continue to execute on our strategic initiatives.
We believe we have established a business platform that should enable us to continue to outperform the nonresidential construction market and to achieve above market growth on both the top line and bottom line in fiscal 2017. Our objective is to
23
continue to execute on our strategic initiatives in order to increase market penetration and deliver growth above nonresidential market growth during fiscal 2017 in our legacy businesses and also in IMP through our multiple sales channels. We expect to have a stronger second half than the first half in fiscal 2017, which is in line with the normal seasonality of our business.
Industry Conditions
Our sales and earnings are subject to both seasonal and cyclical trends and are influenced by general economic conditions, interest rates, the price of steel relative to other building materials, the level of nonresidential construction activity, roof repair and retrofit demand and the availability and cost of financing for construction projects. Our sales are normally lower in the first half of each fiscal year compared to the second half because of unfavorable weather conditions for construction and typical business planning cycles affecting construction.
The nonresidential construction industry is highly sensitive to national and regional macroeconomic conditions. Following a significant downturn in 2008 and 2009, the current recovery of low-rise construction has been uneven and slow, but is now showing some signs of steady growth. The annual volume of new construction starts remains below previous cyclical trough levels of activity from the last 50 years. However, we believe that the economy is recovering and that the nonresidential construction industry will return to mid-cycle levels of activity over the next several years. The graph below shows the annual nonresidential new construction starts, measured in square feet, since 1968, as compiled and reported by Dodge Data & Analytics:
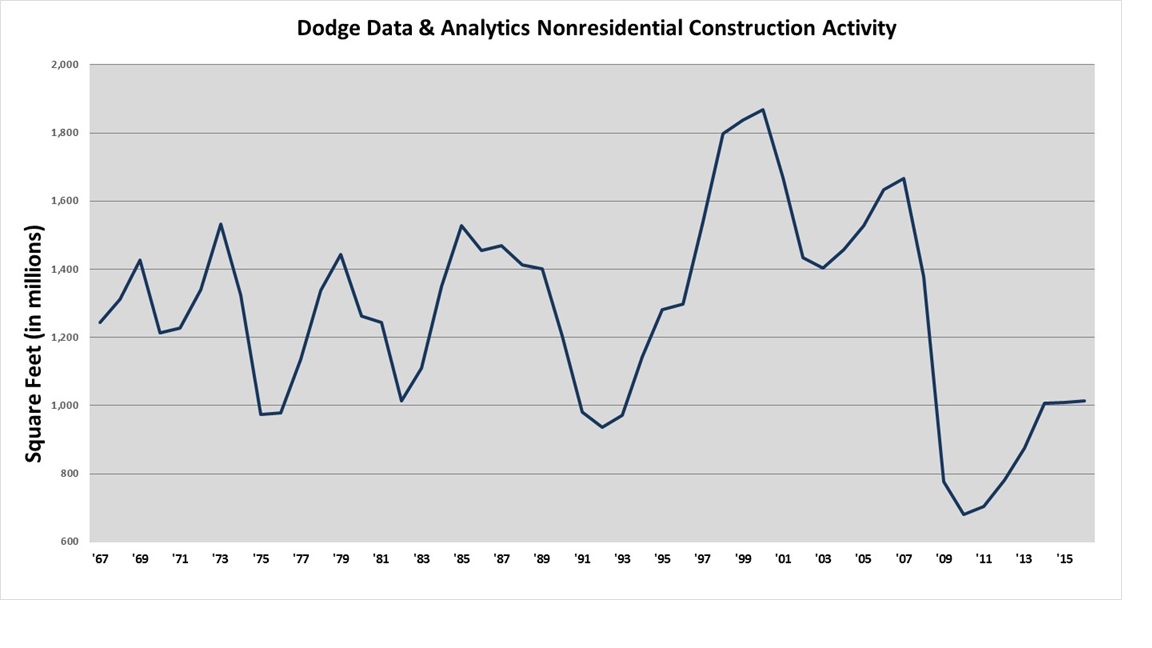
Current market data continues to show uneven activity across the nonresidential construction markets. According to Dodge Data & Analytics, low-rise nonresidential new construction starts, as measured in square feet and comprising buildings of up to five stories, were up approximately 2% during fiscal 2016 as compared to fiscal 2015. Even though this measure tends to be revised upward in succeeding periods, we believe the underlying growth we are achieving is outpacing market activity. Leading indicators for low-rise, nonresidential construction activity indicate continued positive momentum in fiscal 2017.
The leading indicators that we follow and that typically have the most meaningful correlation to nonresidential low-rise construction starts are the American Institute of Architects’ (“AIA”) Architecture Mixed Use Index, Dodge Residential single family starts and the Conference Board Leading Economic Index (“LEI”). Historically, there has been a very high correlation to the Dodge low-rise nonresidential starts when the three leading indicators are combined and then seasonally adjusted. The combined forward projection of these metrics, based on a 9 to 14-month historical lag for each metric, indicates low single-digit growth for low-rise new construction starts in fiscal 2017.
We normally do not maintain an inventory of steel in excess of our current production requirements. However, from time to time, we may purchase steel in advance of announced steel price increases. We can give no assurance that steel will be readily available or that prices will not continue to be volatile. While most of our sales contracts have escalation clauses that allow us, under certain circumstances, to pass along all or a portion of increases in the price of steel after the date of the contract but prior to delivery, for competitive or other reasons, we may not be able to pass such price increases along. If the available supply of steel
24
declines, we could experience price increases that we are not able to pass on to the end users, a deterioration of service from our suppliers or interruptions or delays that may cause us not to meet delivery schedules to our customers. Any of these problems could adversely affect our results of operations and financial condition. For additional discussion, see “Item 3. Quantitative and Qualitative Disclosures About Market Risk — Steel Prices.”
Restructuring
We continue to execute on our plans to improve cost efficiency through the optimization of our combined manufacturing plant footprint and the elimination of certain fixed and indirect ESG&A costs. During the three months ended April 30, 2017, we incurred charges of $0.3 million associated with restructuring actions, including $0.2 million and $0.1 million associated with our engineered building systems and metal components segments, respectively. The Company closed one manufacturing facility in the metal components segment during the second quarter of fiscal 2017.
The Company believes that the successful execution of these plans in phases over the next 24 months will result in annual cost savings ranging between $30.0 million and $40.0 million when completed, of which between approximately $18.0 million and $28.0 million represents the aggregate expected incremental cost savings to be realized in fiscal years 2017 and 2018. We are currently unable to make a good faith determination of cost estimates, or range of cost estimates, for actions associated with the plans. Restructuring charges will be recorded for the plans as they become estimable and probable. See Note 4 — Restructuring and Asset Impairments in the notes to the unaudited consolidated financial statements for additional information.
RESULTS OF OPERATIONS
Operating segments are defined as components of an enterprise that engage in business activities and by which discrete financial information is available that is evaluated on a regular basis by the chief operating decision maker to make decisions about how to allocate resources to the segment and assess the performance of the segment. We have three operating segments: (i) engineered building systems; (ii) metal components; and (iii) metal coil coating. All operating segments operate primarily in the nonresidential construction market. Sales and earnings are influenced by general economic conditions, the level of nonresidential construction activity, metal roof repair and retrofit demand and the availability and terms of financing available for construction. Our operating segments are vertically integrated and benefit from similar basic raw materials. The metal coil coating segment consists of cleaning, treating, painting and slitting continuous steel coils before the steel is fabricated for use by construction and industrial users. The metal components segment products include metal roof and wall panels, doors, metal partitions, metal trim, insulated panels and other related accessories. The engineered building systems segment includes the manufacturing of main frames, Long-Bay® Systems and value-added engineering and drafting, which are typically not part of metal components or metal coil coating products or services. The manufacturing and distribution activities of our segments are effectively coupled through the use of our nationwide hub-and-spoke manufacturing and distribution system, which supports and enhances our vertical integration. The operating segments follow the same accounting policies used for our consolidated financial statements.
We evaluate a segment’s performance based primarily upon operating income before corporate expenses. Intersegment sales are recorded based on standard material costs plus a standard markup to cover labor and overhead and consist of: (i) structural framing provided by the engineered building systems segment to the metal components segment; (ii) building components provided by the metal components segment to the engineered building systems segment; and (iii) hot-rolled, light gauge painted, and slit material and other services provided by the metal coil coating segment to both the metal components and engineered building systems segments.
Corporate assets consist primarily of cash, but also include deferred taxes and property, plant and equipment associated with our headquarters in Houston, Texas. These items (and income and expenses related to these items) are not allocated to the operating segments. Corporate unallocated expenses include share-based compensation expenses, and executive, legal, finance, tax, treasury, human resources, information technology, purchasing, marketing and corporate travel expenses. Additional unallocated amounts primarily include interest income, interest expense and other (expense) income. See Note 16 — Operating Segments in the notes to the unaudited consolidated financial statements for more information on our segments.
The following table represents sales and operating income (loss) attributable to these operating segments for the periods indicated (in thousands):
25
Fiscal Three Months Ended | Fiscal Six Months Ended | ||||||||||||||
April 30, 2017 | May 1, 2016 | April 30, 2017 | May 1, 2016 | ||||||||||||
Total sales: | |||||||||||||||
Engineered building systems | $ | 162,624 | $ | 138,023 | $ | 313,887 | $ | 286,998 | |||||||
Metal components | 270,621 | 234,637 | 515,922 | 464,303 | |||||||||||
Metal coil coating | 63,317 | 55,178 | 127,519 | 106,383 | |||||||||||
Intersegment sales | (76,098 | ) | (55,591 | ) | (145,161 | ) | (115,423 | ) | |||||||
Total sales | $ | 420,464 | $ | 372,247 | $ | 812,167 | $ | 742,261 | |||||||
External sales: | |||||||||||||||
Engineered building systems | $ | 154,456 | $ | 134,454 | $ | 299,477 | $ | 280,405 | |||||||
Metal components | 239,576 | 211,661 | 458,535 | 414,562 | |||||||||||
Metal coil coating | 26,432 | 26,132 | 54,155 | 47,294 | |||||||||||
Total sales | $ | 420,464 | $ | 372,247 | $ | 812,167 | $ | 742,261 | |||||||
Operating income (loss): | |||||||||||||||
Engineered building systems | $ | 6,894 | $ | 7,193 | $ | 13,398 | $ | 19,655 | |||||||
Metal components | 40,087 | 17,835 | 56,117 | 33,938 | |||||||||||
Metal coil coating | 5,514 | 4,704 | 10,758 | 9,525 | |||||||||||
Corporate | (20,023 | ) | (19,138 | ) | (37,915 | ) | (37,265 | ) | |||||||
Total operating income | $ | 32,472 | $ | 10,594 | $ | 42,358 | $ | 25,853 | |||||||
Unallocated other expense | (6,892 | ) | (6,965 | ) | (13,463 | ) | (13,879 | ) | |||||||
Income before income taxes | $ | 25,580 | $ | 3,629 | $ | 28,895 | $ | 11,974 | |||||||
FISCAL THREE MONTHS ENDED APRIL 30, 2017 COMPARED TO FISCAL THREE MONTHS ENDED MAY 1, 2016
Consolidated sales increased by 13.0%, or $48.2 million, for the three months ended April 30, 2017, compared to the three months ended May 1, 2016. The increase in revenue resulted from higher tonnage volume during the current period, particularly in our metal components and metal coil coating segments, as well as the pass-through effect of rising steel prices. The increase was also related to commercial sales discipline across our segments and improved product mix, particularly sales of IMP.
Consolidated cost of sales increased by 12.6%, or $35.7 million, for the three months ended April 30, 2017, compared to the three months ended May 1, 2016. The increase in cost of sales resulted primarily from higher tonnage volume and higher material costs during the current period, partially offset by manufacturing efficiencies achieved on higher tonnage volume.
Gross margin percentage was 24.0% for the three months ended April 30, 2017, compared to 24.0% for the same period in the prior year. Gross margin for the second quarter of fiscal 2017 was positively impacted by improved product sales mix, increased operating leverage from higher tonnage volume, and continued focus on commercial sales discipline, offset by higher material costs due to the rising steel prices.
Engineered building systems sales increased by 17.8%, or $24.6 million, to $162.6 million in the three months ended April 30, 2017, from $138.0 million in the same period in the prior year. Sales to third parties for the three months ended April 30, 2017 increased by $20.0 million to $154.5 million from $134.5 million in the same period in the prior year, primarily due to higher tonnage volume. Engineered building systems third-party sales accounted for 36.7% of total consolidated third-party sales in the three months ended April 30, 2017, compared to 36.1% in the three months ended May 1, 2016.
Operating income of the engineered building systems segment decreased to $6.9 million in the three months ended April 30, 2017, from $7.2 million in the same period in the prior year. The $0.3 million decrease resulted primarily from rapidly rising steel costs during the current period as compared to the same period in the prior fiscal year.
Metal components sales increased by 15.3%, or $36.0 million, to $270.6 million in the three months ended April 30, 2017, from $234.6 million in the same period in the prior year. The increase in sales was primarily driven by higher tonnage volume and commercial discipline, as well as improved IMP sales mix. Sales to third parties for the three months ended April 30, 2017 increased by $27.9 million to $239.6 million from $211.7 million in the same period in the prior year. Metal components third-party sales accounted for 57.0% of total consolidated third-party sales in the three months ended April 30, 2017, compared to 56.9% in the three months ended May 1, 2016.
Operating income of the metal components segment increased to $40.1 million in the three months ended April 30, 2017, compared to $17.8 million in the same period in the prior year. The $22.3 million increase was driven primarily by the improved
26
product sales mix and higher manufacturing efficiency. Operating income also includes $9.6 million of gain on insurance recovery for settlements on damaged or destroyed plant and equipment in the current period. There was no corresponding gain in the prior period.
Metal coil coating sales increased by 14.7%, or $8.1 million, to $63.3 million in the three months ended April 30, 2017, compared to $55.2 million in the same period in the prior year. Sales to third parties for the three months ended April 30, 2017 increased by $0.3 million to $26.4 million from $26.1 million in the same period in the prior year, primarily as a result of an increase in tonnage volume as well as the pass-through effect of higher steel prices. Metal coil coating third-party sales accounted for 6.3% of total consolidated third-party sales in the three months ended April 30, 2017, compared to 7.0% in the three months ended May 1, 2016.
Operating income of the metal coil coating segment increased to $5.5 million in the three months ended April 30, 2017, from $4.7 million in the same period in the prior year. The $0.8 million increase was primarily due to the increase in sales as noted above and higher manufacturing efficiency, partially offset by higher material costs.
Consolidated engineering, selling, general and administrative expenses increased to $75.1 million in the three months ended April 30, 2017, compared to $74.6 million in the same period in the prior year. As a percentage of sales, engineering, selling, general and administrative expenses were 17.9% for the three months ended April 30, 2017, as compared to 20.1% for the three months ended May 1, 2016. The $0.5 million increase was primarily due to higher selling costs (e.g., commissions) from higher volumes and execution of our strategic initiatives.
Consolidated intangible amortization remained consistent period over period at $2.4 million in the three months ended April 30, 2017, compared to $2.4 million in the same period in the prior year.
Consolidated strategic development and acquisition related costs for the three months ended April 30, 2017 were $0.1 million, compared to $0.6 million for the three months ended May 1, 2016. These non-operational costs resulted from acquisition-related activities that support our future growth targets and performance goals and generally include external legal, financial and due diligence costs incurred to pursue specific acquisition targets or costs directly associated with integrating previous acquisitions.
Consolidated restructuring and impairment charges for the three months ended April 30, 2017 and May 1, 2016 were $0.3 million and $1.1 million, respectively. These charges, primarily consisting of severance related costs, relate to our actions taken to streamline our management and engineering and drafting activities, and also to optimize our overall manufacturing structure and footprint. We closed one facility during the second quarter of fiscal 2017 in our metal components segment.
Consolidated gain on insurance recovery for the three months ended April 30, 2017 was $9.6 million, which related to settlements with the Company’s insurers for property damage to two facilities in the metal components segment. There was no corresponding gain in the three months ended May 1, 2016.
Consolidated interest expense decreased to $7.5 million for the three months ended April 30, 2017, compared to $7.8 million for the same period of the prior year. The decrease in interest expense is a primarily a result of voluntary principal prepayments we have made on our Term Loan during fiscal 2017 and 2016.
Consolidated foreign exchange gain (loss) for the three months ended April 30, 2017 was $0.1 million, compared to $0.6 million for the same period of the prior year, due to exchange rate fluctuations in the Mexican peso and Canadian dollar relative to the U.S. dollar.
Consolidated provision for income taxes was $8.6 million for the three months ended April 30, 2017, compared to $1.2 million for the same period in the prior year. The effective tax rate for the three months ended April 30, 2017 was 33.6%, compared to 33.3% for the same period in the prior year. The provision for income taxes was higher in the current period primarily due to higher pre-tax income. The provision for income taxes for the three months ended April 30, 2016 included a benefit related to the non-taxable gain from bargain purchase associated with the acquisition of the Hamilton operations. There was no corresponding benefit in the current period.
FISCAL SIX MONTHS ENDED APRIL 30, 2017 COMPARED TO FISCAL SIX MONTHS ENDED MAY 1, 2016
Consolidated sales increased by 9.4%, or $69.9 million, for the six months ended April 30, 2017, compared to the six months ended May 1, 2016. The increase in revenue resulted from higher tonnage volume during the current period, particularly in our metal components and metal coil coating segments, as well as the pass-through effect of rising steel prices. The increase was also related to commercial sales discipline across our segments.
Consolidated cost of sales increased by 11.0%, or $62.4 million, for the six months ended April 30, 2017, compared to the six months ended May 1, 2016. The increase in cost of sales resulted primarily from higher tonnage volume and higher material costs during the current period, partially offset by manufacturing efficiencies achieved on higher tonnage volume.
Gross margin percentage was 22.8% for the six months ended April 30, 2017, compared to 24.1% for the same period in the prior year. The decrease in gross margin primarily resulted from the temporary impact of higher steel prices, which may significantly
27
impact a period in isolation, but does not typically significantly impact gross margin over a longer time horizon because the cost is ultimately passed through to customers. This impact was partially offset by increased operating leverage from higher tonnage volume and continued focus on value-oriented commercial sales discipline.
Engineered building systems sales increased by 9.4%, or $26.9 million, to $313.9 million in the six months ended April 30, 2017, from $287.0 million in the same period in the prior year. Sales to third parties for the six months ended April 30, 2017 increased by $19.1 million to $299.5 million from $280.4 million in the same period in the prior year, primarily due higher tonnage volume along with commercial discipline. Engineered building systems third-party sales accounted for 36.9% of total consolidated third-party sales in the six months ended April 30, 2017, compared to 37.8% in the six months ended May 1, 2016.
Operating income of the engineered building systems segment decreased to $13.4 million in the six months ended April 30, 2017, from $19.7 million in the same period in the prior year. The $6.3 million decrease resulted primarily from rapidly rising steel costs during the current period as compared to the same period in the prior fiscal year, partially offset by an increase in manufacturing efficiencies on higher tonnage volume.
Metal components sales increased by 11.1%, or $51.6 million, to $515.9 million in the six months ended April 30, 2017, from $464.3 million in the same period in the prior year. The increase in sales was primarily driven by higher tonnage volume and commercial discipline and improved product mix, particularly sales of IMP. Sales to third parties for the six months ended April 30, 2017 increased by $44.0 million to $458.5 million from $414.6 million in the same period in the prior year. Metal components third-party sales accounted for 56.5% of total consolidated third-party sales in the six months ended April 30, 2017, compared to 55.9% in the six months ended May 1, 2016.
Operating income of the metal components segment increased to $56.1 million in the six months ended April 30, 2017, compared to $33.9 million in the same period in the prior year. The $22.2 million increase was driven primarily by more favorable product sales mix and the combined benefit of higher sales, effective supply chain management and commercial discipline. Operating income also includes $9.6 million of gain on insurance recovery for settlements on damaged or destroyed plant and equipment in the current period. There was no corresponding gain in the six months ended May 1, 2016.
Metal coil coating sales increased by 19.8%, or $21.1 million, to $127.5 million in the six months ended April 30, 2017, compared to $106.4 million in the same period in the prior year. Sales to third parties for the six months ended April 30, 2017 increased by $6.9 million to $54.2 million from $47.3 million in the same period in the prior year, primarily as a result of an increase in tonnage volume. Metal coil coating third-party sales accounted for 6.7% of total consolidated third-party sales in the six months ended April 30, 2017, compared to 6.4% in the six months ended May 1, 2016.
Operating income of the metal coil coating segment increased to $10.8 million in the six months ended April 30, 2017, from $9.5 million in the same period in the prior year. The $1.2 million increase was primarily due to the increase in sales as noted above from higher tonnage volume as the pass-through effect of steel prices and higher manufacturing efficiency on higher volume, partially offset by less favorable product mix.
Consolidated engineering, selling, general and administrative expenses decreased to $144.2 million in the six months ended April 30, 2017, compared to $144.5 million in the same period in the prior year. As a percentage of sales, engineering, selling, general and administrative expenses were 17.8% for the six months ended April 30, 2017, as compared to 19.5% for the six months ended May 1, 2016. The $0.3 million decrease was primarily due to operating leverage achieved from higher volumes and execution of our strategic initiatives.
Consolidated intangible amortization remained consistent period over period at $4.8 million in the six months ended April 30, 2017, compared to $4.8 million in the same period in the six months ended May 1, 2016.
Consolidated strategic development and acquisition related costs for the six months ended April 30, 2017 were $0.5 million, compared to $1.3 million for the six months ended May 1, 2016. These non-operational costs resulted from acquisition-related activities that support our future growth targets and performance goals and generally include external legal, financial and due diligence costs incurred to pursue specific acquisition targets or costs directly associated with integrating previous acquisitions.
Consolidated restructuring and impairment charges for the six months ended April 30, 2017 and May 1, 2016 were $2.6 million and $2.7 million, respectively. These charges relate to our actions taken to streamline our management and engineering and drafting activities, and also to optimize our overall manufacturing structure and footprint. We closed three facilities during the six months ended April 30, 2017, including one in our engineered building systems segment and two in our metal components segment, and incurred primarily severance-related costs in connection with these closures.
Consolidated gain on insurance recovery for the three months ended April 30, 2017 was $9.6 million, which related to settlements with the Company’s insurers for property damage to two facilities in the metal components segment. There was no corresponding gain in the six months ended May 1, 2016.
28
Consolidated interest expense decreased to $14.4 million for the six months ended April 30, 2017, compared to $15.7 million for the same period of the prior year. The decrease in interest expense is a primarily a result of voluntary principal prepayments the Company made on its Term Loan during fiscal 2017 and 2016.
Consolidated foreign exchange gain (loss) for the six months ended April 30, 2017 was $0.1 million, compared to $(0.2) million for the same period of the prior year, due to exchange rate fluctuations in the Mexican peso and Canadian dollar relative to the U.S. dollar.
Consolidated provision for income taxes was $9.9 million for the six months ended April 30, 2017, compared to $3.7 million for the same period in the prior year. The effective tax rate for the six months ended April 30, 2017 was 34.2%, compared to 30.6% for the same period in the prior year. The provision for income taxes was higher in the current period primarily due to higher pre-tax income. The change in the effective tax rate was primarily driven by a one-time adjustment in the first quarter of fiscal 2016 related to the research and development credit for fiscal 2015 that was permanently extended in the Protecting Americans from Tax Hikes Act of 2015 and was signed into law in fiscal 2016 as well as the nontaxable gain on bargain purchase from the Hamilton acquisition. There were no corresponding item in the six months ended April 30, 2017.
LIQUIDITY AND CAPITAL RESOURCES
General
Our cash and cash equivalents decreased from $65.4 million as of October 30, 2016 to $49.7 million as of April 30, 2017. The following table summarizes our consolidated cash flows for the six months ended April 30, 2017 and May 1, 2016 (in thousands):
Fiscal Six Months Ended | |||||||
April 30, 2017 | May 1, 2016 | ||||||
Net cash provided by operating activities | $ | 6,374 | $ | 20,013 | |||
Net cash used in investing activities | (8,603 | ) | (9,960 | ) | |||
Net cash used in financing activities | (13,429 | ) | (31,950 | ) | |||
Effect of exchange rate changes on cash and cash equivalents | (63 | ) | 151 | ||||
Net decrease in cash and cash equivalents | (15,721 | ) | (21,746 | ) | |||
Cash and cash equivalents at beginning of period | 65,403 | 99,662 | |||||
Cash and cash equivalents at end of period | $ | 49,682 | $ | 77,916 | |||
Operating Activities
Our business is both seasonal and cyclical and cash flows from operating activities may fluctuate during the year and from year to year due to economic conditions. We rely on cash and short-term borrowings, when needed, to meet cyclical and seasonal increases in working capital needs. These needs generally rise during periods of increased economic activity or increasing raw material prices due to higher levels of inventory and accounts receivable. During economic slowdowns, or periods of decreasing raw material costs, working capital needs generally decrease as a result of the reduction of inventories and accounts receivable.
Net cash provided by operating activities was $6.4 million during the six months ended April 30, 2017 compared to net cash provided by operating activities of $20.0 million in the comparable period of fiscal 2016. The decrease in the current period was primarily due to significant investment in working capital by the Company in the first quarter of fiscal 2017, partially offset by strong earnings in the first half of fiscal 2017 as compared to the same period in the prior year.
Net cash provided by accounts receivable was $12.2 million for the six months ended April 30, 2017, compared to $25.3 million for the six months ended May 1, 2016. Our days sales outstanding as of April 30, 2017 and May 1, 2016 were 34.7 days and 33.7 days, respectively. The increase in our accounts receivable balance from the prior period was primarily the result of higher sales during the current period.
For the six months ended April 30, 2017, the change in cash flows relating to inventory was $15.2 million and resulted partially from higher inventory purchases to support higher sales, and also due to purchases in advance of steel price increases. Our days inventory on-hand increased to 55.2 days as of April 30, 2017 from 48.4 days as of May 1, 2016.
Net cash used in accounts payable for the six months ended April 30, 2017 was $21.7 million, down from $24.6 million in the six months ended May 1, 2016. Our vendor payments can significantly fluctuate based on the timing of disbursements, inventory purchases and vendor payment terms. Our days payable outstanding as of April 30, 2017 decreased to 32.3 days from 35.6 days as of May 1, 2016.
29
Investing Activities
Net cash used in investing activities decreased during the six months ended April 30, 2017 to $8.6 million from $10.0 million in the comparable period in the prior year. We used $11.6 million for capital expenditures in the six months ended April 30, 2017. We sold assets that had been classified as held for sale for $2.5 million during the six months ended April 30, 2017.
In the six months ended May 1, 2016, $10.3 million in cash was used for capital expenditures and $4.3 million was used for the acquisitions of CENTRIA and the Hamilton operations. Additionally, we sold assets that had been classified as held for sale for $4.7 million during the fiscal six months ended May 1, 2016.
Financing Activities
Net cash used in financing activities was $13.4 million during the six months ended April 30, 2017 compared to $32.0 million in the comparable prior year period. During the six months ended April 30, 2017, we made a $10.0 million voluntary principal prepayment on borrowings under our Credit Agreement, borrowed $35.0 million on our Amended ABL Facility and fully repaid that amount as of the end of the period, used $3.5 million to repurchase shares of our outstanding common stock under the program approved by the Board of Directors in September 2016 and used $2.4 million for purchases of shares related to restricted stock that were withheld to satisfy minimum tax withholding obligations arising in connection with the vesting of restricted stock awards and units. We received $1.2 million in cash proceeds from the exercises of stock options.
During the six months ended May 1, 2016, we used $12.4 million to repurchase shares of our outstanding common stock under the program approved by the Board of Directors in January 2016, as well as shares of restricted stock that were withheld to satisfy minimum tax withholding obligations arising in connection with the vesting of awards of restricted stock, and $20.0 million to make a voluntary principal prepayment on borrowings under our Credit Agreement. We received $1.4 million in cash proceeds from the exercises of stock options.
We invest our excess cash in various overnight investments which are issued or guaranteed by the U.S. federal government.
Debt
As of April 30, 2017, we had an aggregate principal amount of $394.1 million of outstanding indebtedness, comprising $144.1 million of borrowings under our Credit Agreement and $250.0 million in aggregate principal amount of 8.25% senior notes due 2023. Our excess availability under the Amended ABL Facility was $139.9 million as of April 30, 2017. In addition, standby letters of credit related to certain insurance policies totaling approximately $10.0 million were outstanding but undrawn under the Amended ABL Facility. At April 30, 2017, we had no revolving loans outstanding under the Amended ABL Facility.
On May 2, 2017, the Company entered into Amendment No. 2 (the “Amendment”) to its existing Credit Agreement, dated as of June 22, 2012, between NCI Building Systems, Inc., as borrower, and Credit Suisse AG, Cayman Islands Branch, as administrative agent and collateral agent and the other financial institutions party thereto from time to time (as previously amended by Amendment No. 1, dated as of June 24, 2013, the “Existing Term Loan Facility” and, as amended, the “Term Loan Facility”)), primarily to extend the maturity date and reduce the interest rate applicable to all of the outstanding term loans under the Term Loan Facility.
Prior to the Amendment, approximately $144.1 million of term loans (the “Existing Term Loans”) were outstanding under the Existing Term Loan Facility. Pursuant to the Amendment, certain lenders under the Existing Term Loan Facility extended their Existing Term Loans, in an aggregate amount, along with new term loans advanced by certain new lenders of approximately $144.1 million (the “New Term Loans”). The proceeds of the New Term Loans advanced by the new lenders were used to prepay in full all of the Existing Term Loans that were not extended as New Term Loans. Pursuant to the Amendment, the maturity date of the New Term Loans was extended to June 24, 2022.
Pursuant to the Amendment, the New Term Loans will bear interest at a floating rate measured by reference to, at the Company’s option, either (i) an adjusted LIBOR not less than 1.00% plus a borrowing margin of 3.00% per annum or (ii) an alternative base rate plus a borrowing margin of 2.00% per annum.
The New Term Loans will be secured by the same collateral and guaranteed by the same guarantors as the Existing Term Loans under the Existing Term Loan Facility. Voluntary prepayments of the New Term Loans are permitted at any time, in minimum principal amounts, without premium or penalty, subject to a 1.00% premium payable in connection with certain repricing transactions within the first six months. The Amendment also includes certain other changes to the Term Loan Facility.
For additional information, see Note 11 — Long-Term Debt and Note Payable and Note 18 — Subsequent Events in the notes to the unaudited consolidated financial statements.
Equity Investment
On August 14, 2009, the Company entered into an Investment Agreement (as amended, the “Investment Agreement”), by and between the Company and Clayton, Dubilier & Rice Fund VIII, L.P. (“CD&R Fund VIII”). In connection with the Investment
30
Agreement and the Stockholders Agreement dated October 20, 2009 (the “Stockholders Agreement”), the CD&R Fund VIII and the Clayton, Dubilier & Rice Friends & Family Fund VIII, L.P. (collectively, the “CD&R Funds”) purchased convertible preferred stock, which was converted into shares of our Common Stock on May 14, 2013.
At April 30, 2017 and October 30, 2016, the CD&R Funds owned approximately 42.3% and 42.3%, respectively, of the outstanding shares of our common stock.
Cash Flow
We periodically evaluate our liquidity requirements, capital needs and availability of resources in view of inventory levels, expansion plans, debt service requirements and other operating cash needs. To meet our short- and long-term liquidity requirements, including payment of operating expenses and repaying debt, we rely primarily on cash from operations. Beyond cash generated from operations, our Amended ABL Facility is undrawn with $139.9 million available at April 30, 2017 and we have a cash balance of $49.7 million as of April 30, 2017.
We expect to contribute $1.1 million to our defined benefit plans during the remainder of fiscal 2017.
We expect that, for the next 12 months, cash generated from operations and our Amended ABL Facility will be sufficient to provide us the ability to fund our operations, provide the increased working capital necessary to support our strategy and fund planned capital expenditures of between approximately $25 million and $30 million for fiscal 2017 and expansion when needed.
Our corporate strategy seeks potential acquisitions that would provide additional synergies in our engineered building systems, metal components and metal coil coating segments. From time to time, we may enter into letters of intent or agreements to acquire assets or companies in these business lines. The consummation of these transactions could require substantial cash payments and/or issuance of additional debt.
From time to time, we have used available funds to repurchase shares of our common stock under our stock repurchase programs. On September 8, 2016, our Board of Directors authorized a stock repurchase program for the repurchase of up to an aggregate of $50.0 million of the Company’s outstanding Common Stock. Under this repurchase program, the Company is authorized to repurchase shares, if at all, at times and in amounts that we deem appropriate in accordance with all applicable securities laws and regulations. Shares repurchased are usually retired. There is no time limit on the duration of the program. At April 30, 2017, approximately $39.9 million remained available for stock repurchases under the program. In addition to the common stock repurchased during the six months ended April 30, 2017 under our stock repurchase programs, we also withheld shares of restricted stock to satisfy minimum tax withholding obligations arising in connection with the vesting of awards of restricted stock related to our 2003 Long-Term Stock Incentive Plan.
The Company may repurchase, redeem or otherwise retire the Company’s debt and take other steps to reduce the Company’s debt or otherwise improve the Company’s financial position. These actions could include open market debt repurchases, negotiated repurchases, other redemptions or retirements of outstanding debt, opportunistic refinancing of debt and raising additional capital. The amount of debt that may be repurchased or otherwise retired, if any, will depend on market conditions, trading levels of the Company’s debt, the Company’s cash position, compliance with debt covenants and other considerations. Affiliates of the Company may also purchase the Company’s debt from time to time through open market purchases or other transactions. In such cases, the Company’s debt may not be retired, in which case the Company would continue to pay interest in accordance with the terms of the debt, and the Company would continue to reflect the debt as outstanding on its consolidated balance sheets.
NON-GAAP MEASURES
Set forth below are certain non-GAAP measures which include adjusted operating income (loss), adjusted EBITDA, adjusted net income per diluted common share and adjusted net income applicable to common shares. We define adjusted operating income (loss) as operating income (loss) adjusted for items broadly consisting of selected items which management does not consider representative of our ongoing operations and certain non-cash items of the Company. We define adjusted EBITDA as net income (loss) before interest expense, income tax expense (benefit) and depreciation and amortization, adjusted for items broadly consisting of selected items which management does not consider representative of our ongoing operations and certain non-cash items of the Company. Such measurements are not prepared in accordance with U.S. GAAP and should not be construed as an alternative to reported results determined in accordance with U.S. GAAP. Management believes the use of such non-GAAP measures on a consolidated and operating segment basis assists investors in understanding the ongoing operating performance by presenting the financial results between periods on a more comparable basis. You are encouraged to evaluate these adjustments and the reasons we consider them appropriate for supplemental analysis. In evaluating these measures, you should be aware that in the future we may incur expenses that are the same as, or similar to, some of the adjustments in these non-GAAP measures. In addition, certain financial covenants related to our Credit Agreement, Amended ABL Facility, and Notes are based on similar non-GAAP measures. The non-GAAP information provided is unique to the Company and may not be consistent with the methodologies used by other companies.
31
The following tables reconcile adjusted operating income (loss) to operating income (loss) for the periods indicated (in thousands):
Three Months Ended April 30, 2017 | |||||||||||||||||||
Engineered Building Systems | Metal Components | Metal Coil Coating | Corporate | Consolidated | |||||||||||||||
Operating income (loss), GAAP basis | $ | 6,894 | $ | 40,087 | $ | 5,514 | $ | (20,023 | ) | $ | 32,472 | ||||||||
Restructuring and impairment charges | 186 | 129 | — | — | 315 | ||||||||||||||
Strategic development and acquisition related costs | — | — | — | 124 | 124 | ||||||||||||||
Loss on sale of assets | 137 | — | — | — | 137 | ||||||||||||||
(Gain) on insurance recovery | — | (9,601 | ) | — | — | (9,601 | ) | ||||||||||||
Unreimbursed business interruption costs | — | 191 | — | — | 191 | ||||||||||||||
Adjusted operating income (loss) | $ | 7,217 | $ | 30,806 | $ | 5,514 | $ | (19,899 | ) | $ | 23,638 | ||||||||
Three Months Ended May 1, 2016 | |||||||||||||||||||
Engineered Building Systems | Metal Components | Metal Coil Coating | Corporate | Consolidated | |||||||||||||||
Operating income (loss), GAAP basis | $ | 7,193 | $ | 17,835 | $ | 4,704 | $ | (19,138 | ) | $ | 10,594 | ||||||||
Restructuring and impairment charges | 149 | 608 | 39 | 353 | 1,149 | ||||||||||||||
Strategic development and acquisition related costs | — | 28 | — | 551 | 579 | ||||||||||||||
(Gain) on sale of assets and asset recovery | (927 | ) | — | — | — | (927 | ) | ||||||||||||
Adjusted operating income (loss) | $ | 6,415 | $ | 18,471 | $ | 4,743 | $ | (18,234 | ) | $ | 11,395 | ||||||||
Six Months Ended April 30, 2017 | |||||||||||||||||||
Engineered Building Systems | Metal Components | Metal Coil Coating | Corporate | Consolidated | |||||||||||||||
Operating income (loss), GAAP basis | $ | 13,398 | $ | 56,117 | $ | 10,758 | $ | (37,915 | ) | $ | 42,358 | ||||||||
Restructuring and impairment charges | 2,095 | 434 | — | 49 | 2,578 | ||||||||||||||
Strategic development and acquisition related costs | — | — | — | 481 | 481 | ||||||||||||||
Loss on sale of assets | 137 | — | — | — | 137 | ||||||||||||||
(Gain) on insurance recovery | — | (9,601 | ) | — | — | (9,601 | ) | ||||||||||||
Unreimbursed business interruption costs | — | 191 | — | — | 191 | ||||||||||||||
Adjusted operating income (loss) | $ | 15,630 | $ | 47,141 | $ | 10,758 | $ | (37,385 | ) | $ | 36,144 | ||||||||
32
Six Months Ended May 1, 2016 | |||||||||||||||||||
Engineered Building Systems | Metal Components | Metal Coil Coating | Corporate | Consolidated | |||||||||||||||
Operating income (loss), GAAP basis | $ | 19,655 | $ | 33,938 | $ | 9,525 | $ | (37,265 | ) | $ | 25,853 | ||||||||
Restructuring and impairment charges | 649 | 889 | 39 | 1,082 | 2,659 | ||||||||||||||
Strategic development and acquisition related costs | — | 400 | — | 860 | 1,260 | ||||||||||||||
(Gain) on sale of assets and asset recovery | (1,652 | ) | — | — | — | (1,652 | ) | ||||||||||||
Adjusted operating income (loss) | $ | 18,652 | $ | 35,227 | $ | 9,564 | $ | (35,323 | ) | $ | 28,120 | ||||||||
The following tables reconcile adjusted EBITDA to net income for the periods indicated (in thousands):
3rd Quarter July 31, 2016 | 4th Quarter October 30, 2016 | 1st Quarter January 29, 2017 | 2nd Quarter April 30, 2017 | Trailing 12 Months April 30, 2017 | |||||||||||||||
Net income | $ | 23,715 | $ | 19,001 | $ | 2,039 | $ | 16,974 | $ | 61,729 | |||||||||
Add: | |||||||||||||||||||
Depreciation and amortization | 10,595 | 9,817 | 10,315 | 10,062 | 40,789 | ||||||||||||||
Consolidated interest expense, net | 7,685 | 7,548 | 6,881 | 7,341 | 29,455 | ||||||||||||||
Provision for income taxes | 11,627 | 12,649 | 1,275 | 8,606 | 34,157 | ||||||||||||||
Restructuring and impairment charges | 778 | 815 | 2,264 | 315 | 4,172 | ||||||||||||||
Strategic development and acquisition related costs | 819 | 590 | 357 | 124 | 1,890 | ||||||||||||||
Share-based compensation | 2,661 | 3,181 | 3,042 | 2,820 | 11,704 | ||||||||||||||
(Gain) loss on sale of assets and asset recovery | (52 | ) | 62 | — | 137 | 147 | |||||||||||||
(Gain) on insurance recovery | — | — | — | (9,601 | ) | (9,601 | ) | ||||||||||||
Unreimbursed business interruption costs | — | — | — | 191 | 191 | ||||||||||||||
Adjusted EBITDA | $ | 57,828 | $ | 53,663 | $ | 26,173 | $ | 36,969 | $ | 174,633 | |||||||||
33
3rd Quarter August 2, 2015 | 4th Quarter November 1, 2015 | 1st Quarter January 31, 2016 | 2nd Quarter May 1, 2016 | Trailing 12 Months May 1, 2016 | |||||||||||||||
Net income | $ | 7,220 | $ | 18,407 | $ | 5,892 | $ | 2,420 | $ | 33,939 | |||||||||
Add: | |||||||||||||||||||
Depreciation and amortization | 14,541 | 13,354 | 10,747 | 10,765 | 49,407 | ||||||||||||||
Consolidated interest expense, net | 8,135 | 7,993 | 7,847 | 7,792 | 31,767 | ||||||||||||||
Provision for income taxes | 3,520 | 10,029 | 2,453 | 1,209 | 17,211 | ||||||||||||||
Restructuring and impairment charges | 504 | 7,611 | 1,510 | 1,149 | 10,774 | ||||||||||||||
(Gain) from bargain purchase | — | — | (1,864 | ) | — | (1,864 | ) | ||||||||||||
Strategic development and acquisition related costs | 701 | 1,143 | 681 | 579 | 3,104 | ||||||||||||||
(Gain) on legal settlements | — | (3,765 | ) | — | — | (3,765 | ) | ||||||||||||
Fair value adjustments of acquired inventory | 1,000 | — | — | 1,000 | |||||||||||||||
Share-based compensation | 2,568 | 1,677 | 2,582 | 2,468 | 9,295 | ||||||||||||||
(Gain) on sale of assets and asset recovery | — | — | (725 | ) | (927 | ) | (1,652 | ) | |||||||||||
Adjusted EBITDA | $ | 38,189 | $ | 56,449 | $ | 29,123 | $ | 25,455 | $ | 149,216 | |||||||||
34
The following tables reconcile adjusted net income per diluted common share to net income per diluted common share and adjusted net income applicable to common shares to net income applicable to common shares for the periods indicated (in thousands):
Fiscal Three Months Ended | Fiscal Six Months Ended | ||||||||||||||
April 30, 2017 | May 1, 2016 | April 30, 2017 | May 1, 2016 | ||||||||||||
Net income per diluted common share, GAAP basis | $ | 0.24 | $ | 0.03 | $ | 0.27 | $ | 0.11 | |||||||
Restructuring and impairment charges | 0.00 | 0.02 | 0.04 | 0.04 | |||||||||||
Strategic development and acquisition related costs | 0.00 | 0.01 | 0.01 | 0.02 | |||||||||||
(Gain) on insurance recovery | (0.13 | ) | — | (0.14 | ) | — | |||||||||
Unreimbursed business interruption costs | 0.00 | — | 0.00 | — | |||||||||||
Other losses (gains), net | 0.00 | (0.01 | ) | 0.00 | (0.05 | ) | |||||||||
Tax effect of applicable non-GAAP adjustments(1) | 0.05 | (0.01 | ) | 0.03 | (0.01 | ) | |||||||||
Adjusted net income per diluted common share | $ | 0.16 | $ | 0.04 | $ | 0.21 | $ | 0.11 | |||||||
Fiscal Three Months Ended | Fiscal Six Months Ended | ||||||||||||||
April 30, 2017 | May 1, 2016 | April 30, 2017 | May 1, 2016 | ||||||||||||
Net income applicable to common shares, GAAP basis | $ | 16,859 | $ | 2,397 | $ | 18,882 | $ | 8,233 | |||||||
Restructuring and impairment charges | 315 | 1,149 | 2,578 | 2,659 | |||||||||||
Strategic development and acquisition related costs | 124 | 579 | 481 | 1,260 | |||||||||||
(Gain) on insurance recovery | (9,601 | ) | — | (9,601 | ) | — | |||||||||
Unreimbursed business interruption costs | 191 | — | 191 | — | |||||||||||
Other losses (gains), net | 137 | (927 | ) | 137 | (3,516 | ) | |||||||||
Tax effect of applicable non-GAAP adjustments(1) | 3,445 | (312 | ) | 2,423 | (884 | ) | |||||||||
Adjusted net income applicable to common shares | $ | 11,470 | $ | 2,886 | $ | 15,091 | $ | 7,752 | |||||||
(1) | The Company calculated the tax effect of non-GAAP adjustments by applying the applicable statutory tax rate for the period to each applicable non-GAAP item. |
OFF-BALANCE SHEET ARRANGEMENTS
As part of our ongoing business, we do not participate in transactions that generate relationships with unconsolidated entities or financial partnerships, such as entities often referred to as structured finance or special purpose entities (“SPEs”), which would have been established for the purpose of facilitating off-balance sheet arrangements or other contractually narrow or limited purposes. As of April 30, 2017, we were not involved in any material unconsolidated SPE transactions.
CONTRACTUAL OBLIGATIONS
In general, purchase orders issued in the normal course of business can be terminated in whole or in part for any reason without liability until the product is received.
Other than the Amendment to the Credit Agreement that extended the maturity date of the New Term Loans to June 24, 2022, there have been no material changes in our future contractual obligations since the end of fiscal 2016. See Part 2, Item 7 of our Annual Report on Form 10-K for the fiscal year ended October 30, 2016 for more information on our contractual obligations. See Note 11 — Long-Term Debt and Note Payable and Note 18 — Subsequent Events in the notes to the unaudited consolidated financial statements for more information on the material terms of our Notes, Credit Agreement and Amended ABL Facility.
CRITICAL ACCOUNTING POLICIES
Critical accounting policies are those that are most important to the portrayal of our financial position and results of operations. These policies require our most subjective judgments, often employing the use of estimates about the effect of matters that are inherently uncertain. Our most critical accounting policies include those that pertain to revenue recognition, insurance accruals, share-based compensation, income taxes, accounting for acquisitions, intangible assets and goodwill, allowance for doubtful accounts, inventory valuation, property, plant and equipment valuation and contingencies, which are described in Item 7 of our Annual Report on Form 10-K for the year ended October 30, 2016.
35
RECENT ACCOUNTING PRONOUNCEMENTS
In May 2014, the FASB issued ASU 2014-09, Revenue from Contracts with Customers (Topic 606). ASU 2014-09 supersedes the revenue recognition requirements in ASC Topic 605, Revenue Recognition, and most industry-specific guidance. The core principle of the guidance is that an entity should recognize revenue to depict the transfer of promised goods or services to customers in an amount that reflects the consideration to which the entity expects to be entitled in exchange for those goods or services. During 2016, the FASB also issued ASU 2016-08, Revenue from Contracts with Customers: Principal versus Agent Considerations (Reporting Revenue Gross versus Net); ASU 2016-10, Revenue from Contracts with Customers: Identifying Performance Obligations and Licensing; ASU 2016-11, Rescission of SEC Guidance Because of Accounting Standards Updates 2014-09 and 2014-16 Pursuant to Staff Announcements at the March 3, 2016 EITF Meeting; and ASU 2016-12, Revenue from Contracts with Customers: Narrow-Scope Improvements and Practical Expedients; and ASU 2016-20, Technical Corrections and Improvements to Topic 606, Revenue from Contracts with Customers, all of which were issued to improve and clarify the guidance in ASU 2014-09. These ASUs are effective for our fiscal year ending November 3, 2019, including interim periods within that fiscal year, and will be adopted using either a full or modified retrospective approach. We are currently assessing the potential effects of these changes to our consolidated financial statements.
In July 2015, the FASB issues ASU 2015-11, Inventory (Topic 330): Simplifying the Measurement of Inventory. ASU 2015-11 requires that inventory that has historically been measured using first-in, first-out (FIFO) or average cost method should now be measured at the lower of cost and net realizable value. The update requires prospective application and is effective for our fiscal year ending October 28, 2018, including interim periods within that fiscal year. We do not expect that the adoption of this guidance will have a material impact on our consolidated financial statements.
In November 2015, the FASB issued ASU 2015-17, Balance Sheet Classification of Deferred Taxes. ASU 2015-17 requires all deferred tax assets and liabilities to be presented on the balance sheet as noncurrent. ASU 2015-17 is effective for our fiscal year ending October 28, 2018, including interim periods within that fiscal year. Upon adoption, we will present the net deferred tax assets as noncurrent and reclassify any current deferred tax assets and liabilities in our consolidated financial position on a retrospective basis.
In February 2016, the FASB issued ASU 2016-02, Leases, which will require lessees to record most leases on the balance sheet and modifies the classification criteria and accounting for sales-type leases and direct financing leases for lessors. ASU 2016-02 is effective for our fiscal year ending November 1, 2020, including interim periods within that fiscal year. The guidance requires entities to use a modified retrospective approach for leases that exist or are entered into after the beginning of the earliest comparative period in the financial statements. We are evaluating the impact that the adoption of this guidance will have on our consolidated financial statements.
In March 2016, the FASB issued ASU 2016-09, Improvements to Employee Share-Based Payment Accounting, which is intended to simplify certain aspects of the accounting for share-based payment award transactions, including income tax effects when awards vest or settle, repurchase of employees’ shares to satisfy statutory tax withholding obligations, an option to account for forfeitures as they occur, and classification of certain amounts on the statement of cash flows. ASU 2016-09 is effective for our fiscal year ending October 28, 2018, including interim periods within that fiscal year. We are evaluating the impact that the adoption of this ASU will have on our consolidated financial statements.
In June 2016, the FASB issued ASU 2016-13, Financial Instruments—Credit Losses (Topic 326): Measurement of Credit Losses on Financial Instruments. This ASU requires an entity to measure all expected credit losses for financial assets, including trade receivables, held at the reporting date based on historical experience, current conditions, and reasonable and supportable forecasts. Entities will now incorporate forward-looking information based on expected losses to estimate credit losses. ASU 2016-13 is effective for our fiscal year ending October 31, 2021, including interim periods within that fiscal year. We are evaluating the impact that the adoption of this ASU will have on our consolidated financial position, result of operations and cash flows.
In August 2016, the FASB issued ASU No. 2016-15, Statement of Cash Flows (Topic 230): Classification of Certain Cash Receipts and Cash Payments, which provides guidance on eight cash flow classification issues with the objective of reducing differences in practice. We will be required to adopt the amendments in this ASU in annual and interim periods for our fiscal year ending November 3, 2019, with early adoption permitted. Adoption is required to be on a retrospective basis, unless impracticable for any of the amendments, in which case a prospective application is permitted. We are evaluating the impact that ASU 2016-15 will have on our consolidated financial statements.
In October 2016, the FASB issued ASU 2016-16, Income Taxes (Topic 740): Intra-Entity Transfers of Assets Other than Inventory, which eliminates the exception that prohibits the recognition of current and deferred income tax effects for intra-entity transfers of assets other than inventory until the asset has been sold to an outside party. We will be required to adopt the amendments in this ASU in the annual and interim periods for our fiscal year ending November 3, 2019, with early adoption permitted. The application of the amendments will require the use of a modified retrospective basis through a cumulative-effect adjustment to retained earnings as of the beginning of the period of adoption. We are evaluating the standard and the impact it will have on our consolidated financial statements.
36
In November 2016, the FASB issued ASU 2016-18, Statement of Cash Flows (Topic 230): Restricted Cash (a consensus of the FASB Emerging Issues Task Force), which clarifies how entities should present restricted cash and restricted cash equivalents in the statement of cash flows. Entities will no longer present transfers between cash and cash equivalents and restricted cash and restricted cash equivalents in the statement of cash flows. An entity with a material balance of restricted cash and restricted cash equivalents must disclose information about the nature of the restrictions. We will be required to adopt this guidance on a retrospective basis in the annual and interim periods for our fiscal year ending November 3, 2019, with early adoption permitted. We are evaluating the impact ASU 2016-18 will have on our consolidated financial statements.
In January 2017, the FASB issued ASU 2017-01, Business Combinations (Topic 805): Clarifying the Definition of a Business. This ASU adds guidance to assist entities with evaluating whether transactions should be accounted for as acquisitions (or disposals) of assets or businesses. Under the new guidance, if a single asset or group of similar identifiable assets comprise substantially all of the fair value of the gross assets acquired (or disposed of) in a transaction, the assets and related activities are not a business. Also, a minimum of an input process and a substantive process must be present and significantly contribute to the ability to create outputs in order to be considered a business. We will be required to adopt this guidance on a prospective basis in the annual and interim periods for our fiscal year ending November 3, 2019, with early adoption permitted. We are evaluating the impact ASU 2017-01 will have on our consolidated financial statements.
In January 2017, the FASB issued ASU 2017-04, Intangibles—Goodwill and Other (Topic 350): Simplifying the Test for Goodwill Impairment. This ASU eliminates Step 2 from the goodwill impairment test and requires an entity to perform its goodwill impairment test by comparing the fair value of a reporting unit with its carrying amount. Under this guidance, an entity should recognize an impairment charge for the amount by which the carrying amount exceeds the reporting unit’s fair value. We will be required to adopt the amendments in this ASU on a prospective basis in the annual and interim periods for our fiscal year ending October 31, 2021, with early adoption permitted. We are evaluating the impact ASU 2017-04 will have on our consolidated financial statements.
In February 2017, the FASB issued ASU 2017-05, Other Income—Gains and Losses from the Derecognition of Nonfinancial Assets (Subtopic 610-20): Clarifying the Scope of Asset Derecognition Guidance and Accounting for Partial Sales of Nonfinancial Assets, which clarifies the scope of guidance on nonfinancial asset derecognition in Accounting Standards Codification 610-20 and the accounting for partial sales of nonfinancial assets. The new guidance also conforms the derecognition guidance for nonfinancial assets with the model in the new revenue standard (ASU 2014-09). We will be required to adopt this guidance on a prospective basis in the annual and interim periods for our fiscal year ending November 3, 2019, and the Company is required to apply the amendments at the same time that it applies the amendments in ASU 2014-09. We are evaluating the impact of adopting this guidance.
In March 2017, the FASB issued ASU 2017-07, Compensation—Retirement Benefits (Topic 715): Improving the Presentation of Net Periodic Pension Cost and Net Periodic Postretirement Benefit Cost, which amends the requirements related to the income statement presentation of the components of net periodic benefit cost for employer sponsored defined benefit pension and other postretirement benefit plans. Under the new guidance, an entity must disaggregate and present the service cost component of net periodic benefit cost in the same income statement line items as other employee compensation costs arising from services rendered during the period, and only the service cost component will be eligible for capitalization. Other components of net periodic benefit cost will be presented separately from the line items that include the service cost. We will be required to adopt this guidance on a prospective basis in the annual and interim periods for our fiscal year ending November 3, 2019, with early adoption permitted. Entities must use a retrospective transition method to adopt the requirement for separate presentation of the income statement service cost and other components, and a prospective transition method to adopt the requirement to limit the capitalization of benefit cost to the service component. We are evaluating the impact of adopting this guidance.
In May 2017, the FASB issued ASU 2017-09, Compensation—Stock Compensation (Topic 718): Scope of Modification Accounting, which provides clarity on the accounting for modifications of stock-based awards. We will be required to adopt this guidance on a prospective basis in the annual and interim periods for our fiscal year ending November 3, 2019 for share-based payment awards modified on or after the adoption date. We are evaluating the impact ASU 2017-09 will have on our consolidated financial statements.
37
Item 3. Quantitative and Qualitative Disclosures About Market Risk.
Steel Prices
We are subject to market risk exposure related to volatility in the price of steel. For the fiscal six months ended April 30, 2017, material costs (predominantly steel costs) constituted approximately 69% of our cost of sales. Our business is heavily dependent on the price and supply of steel. Our various products are fabricated from steel produced by mills to forms including bars, plates, structural shapes, sheets, hot-rolled coils and galvanized or Galvalume® — coated coils (Galvalume® is a registered trademark of BIEC International, Inc.). The steel industry is highly cyclical in nature, and steel prices have been volatile in recent years and may remain volatile in the future. Steel prices are influenced by numerous factors beyond our control, including general economic conditions, domestically and internationally, the availability of raw materials, competition, labor costs, freight and transportation costs, production costs, import duties and other trade restrictions. Based on the cyclical nature of the steel industry, we expect steel prices will continue to be volatile.
Although we have the ability to purchase steel from a number of suppliers, a production cutback by one or more of our current suppliers could create challenges in meeting delivery schedules to our customers. Because we have periodically adjusted our contract prices, particularly in the engineered building systems segment, we have generally been able to pass increases in our raw material costs through to our customers. The graph below shows the monthly CRU Index data for the North American Steel Price Index over a historical eight-year period. The CRU North American Steel Price Index has been published by the CRU Group since 1994 and we believe this index appropriately depicts the volatility we have experienced in steel prices. The index, based on a CRU survey of industry participants, is now commonly used in the settlement of physical and financial contracts in the steel industry. The prices surveyed are purchases for forward delivery, according to lead time, which will vary. For example, the January index would likely approximate our fiscal March steel purchase deliveries based on current lead-times. The volatility in this steel price index is comparable to the volatility we experience in our average cost of steel.
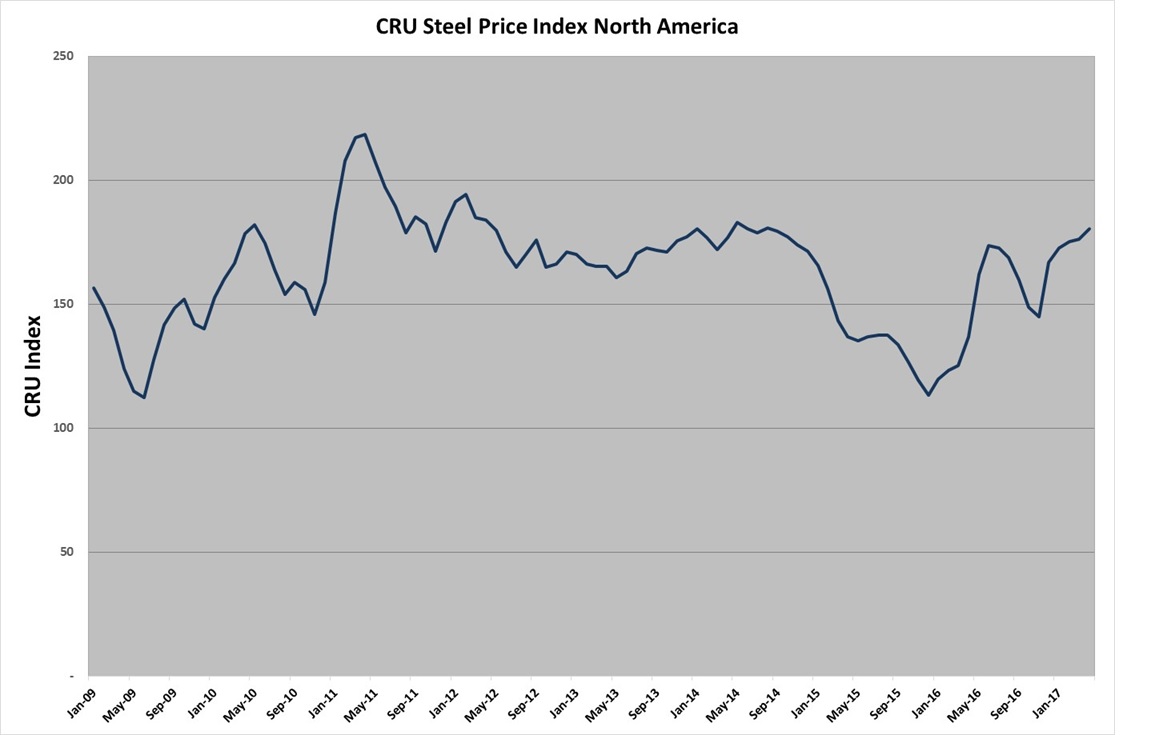
We normally do not maintain an inventory of steel in excess of our current production requirements. However, from time to time, we may purchase steel in advance of announced steel price increases. In addition, it is our current practice to purchase all steel inventory that has been ordered but is not in our possession. Therefore, our inventory may increase if demand for our products declines. We can give no assurance that steel will remain available or that prices will not continue to be volatile.
With material costs (predominantly steel costs) accounting for approximately 69% of our cost of sales for the six months ended April 30, 2017, a one percent change in the cost of steel would have resulted in a pre-tax impact on cost of sales of approximately $4.3 million for the six months ended April 30, 2017. The impact to our financial results of operations of such an
38
increase would be significantly dependent on the competitive environment and the costs of other alternative building products, which could impact our ability to pass on these higher costs.
Other Commodity Risks
In addition to market risk exposure related to the volatility in the price of steel, we are subject to market risk exposure related to volatility in the price of natural gas. As a result, we occasionally enter into both index-priced and fixed-price contracts for the purchase of natural gas. We have evaluated these contracts to determine whether the contracts are derivative instruments. Certain contracts that meet the criteria for characterization as a derivative instrument may be exempted from hedge accounting treatment as normal purchases and normal sales and, therefore, these forward contracts are not marked to market. At April 30, 2017, all of our contracts for the purchase of natural gas met the scope exemption for normal purchases and normal sales.
Interest Rates
We are subject to market risk exposure related to changes in interest rates on our Credit Agreement and the Amended ABL Facility. These instruments bear interest at an agreed upon percentage point spread from either the prime interest rate or LIBOR. Under our Credit Agreement, we may, at our option, fix the interest rate for certain borrowings based on a spread over LIBOR for 30 days to 6 months. At April 30, 2017, we had $144.1 million outstanding under our Credit Agreement. Based on this balance, an immediate change of one percent in the interest rate would cause a change in interest expense of approximately $1.4 million on an annual basis. The fair value of our Credit Agreement at April 30, 2017 and October 30, 2016 was approximately $144.5 million and $154.1 million, respectively, compared to a face value of approximately $144.1 million and $154.1 million, respectively.
See Note 11 — Long-Term Debt and Note Payable in the notes to the unaudited consolidated financial statements for information on the material terms of our long-term debt.
Foreign Currency Exchange Rates
We are exposed to the effect of exchange rate fluctuations on the U.S. dollar value of foreign currency denominated operating revenue and expenses. The functional currency for our Mexico operations is the U.S. dollar. Adjustments resulting from the re-measurement of the local currency financial statements into the U.S. dollar functional currency, which uses a combination of current and historical exchange rates, are included in net income in the current period. Net foreign currency re-measurement gain (loss) was $0.4 million and $0.0 million, for the three month periods ended April 30, 2017 and May 1, 2016, respectively. The net foreign currency re-measurement gain (loss) for the six month periods ended April 30, 2017 and May 1, 2016 was $(0.1) million and $(0.2) million, respectively.
The functional currency for our Canada operations is the Canadian dollar. Translation adjustments resulting from translating the functional currency financial statements into U.S. dollar equivalents are reported separately in accumulated other comprehensive income in stockholders’ equity. The net foreign currency exchange gain (loss) included in net income for the three month periods ended April 30, 2017 and May 1, 2016 was $(0.3) million and $0.6 million, respectively. The net foreign currency exchange gain (loss) included in net income for the six month periods ended April 30, 2017 and May 1, 2016 was $0.1 million and $0.0 million, respectively. Net foreign currency translation adjustment, net of tax, and included in other comprehensive income (loss) for the three month periods ended April 30, 2017 and May 1, 2016 was $(0.1) million and $0.5 million, respectively. Net foreign currency translation adjustment, net of tax, and included in other comprehensive income (loss) for the six month periods ended April 30, 2017 and May 1, 2016 was $(0.1) million and $0.2 million, respectively.
We have operations in China and are exposed to fluctuations in the foreign currency exchange rate between the U.S. dollar and Chinese yuan. The functional currency for our China operations is the Chinese yuan. The net foreign currency translation adjustment was insignificant for the three and six month periods ended April 30, 2017 and May 1, 2016.
39
Item 4. Controls and Procedures.
Disclosure Controls and Procedures
Our management, with the participation of our chief executive officer and chief financial officer, evaluated the effectiveness of our disclosure controls and procedures as of April 30, 2017. The term “disclosure controls and procedures,” as defined in Rules 13a-15(e) and 15d-15(e) under the Exchange Act, means controls and other procedures of a company that are designed to ensure that information required to be disclosed by a company in the reports that it files or submits under the Exchange Act is recorded, processed, summarized and reported, within the time periods specified in the SEC’s rules and forms. Disclosure controls and procedures include, without limitation, controls and procedures designed to ensure that information required to be disclosed by a company in the reports that it files or submits under the Exchange Act is accumulated and communicated to the company’s management, including its principal executive and principal financial officers, as appropriate to allow timely decisions regarding the required disclosure. Management recognizes that any controls and procedures, no matter how well designed and operated, can provide only reasonable assurance of achieving their objectives and management necessarily applies its judgment in evaluating the cost-benefit relationship of possible controls and procedures. Management believes that our disclosure controls and procedures are designed to provide reasonable assurance of achieving their objectives and based on the evaluation of our disclosure controls and procedures as of April 30, 2017, our chief executive officer and chief financial officer concluded that, as of such date, our disclosure controls and procedures were ineffective because the material weaknesses described in Item 9A. Controls and Procedures in our Annual Report on Form 10-K for the fiscal year ended October 30, 2016 continued to exist as of April 30, 2017, as discussed below.
Material Weaknesses Previously Disclosed
We disclosed in Item 9A. Controls and Procedures in our Annual Report on Form 10-K for the fiscal year ended October 30, 2016 that we had identified material weaknesses in our internal controls over financial reporting relating to (1) the control environment of the CENTRIA subsidiary, which the Company acquired in January 2015, and (2) the design of controls over the allocation of total contract consideration in multiple element revenue arrangements within the Company’s engineered building systems segment. In light of the material weaknesses, management performed additional review and other procedures prior to the filing of this Quarterly Report on Form 10-Q, which did not result in any adjustments to the consolidated financial statements. These material weaknesses did not result in any material misstatements to our consolidated financial statements in any prior periods or for the three and six months ended April 30, 2017.
Status of Remediation Efforts to Address Material Weaknesses
We are committed to the remediation of the material weaknesses in a timely manner. We have developed a remediation plan that will address the material weaknesses in internal control over financial reporting and we have implemented certain aspects of our plan as of April 30, 2017, including:
• | Hired a Director of Controls and Compliance, an accounting manager at the CENTRIA subsidiary and made several other personnel changes to bolster the oversight of the Company’s internal control over financial reporting |
• | Formalized and modified certain existing critical accounting procedures for the affected areas of internal control over financial reporting |
• | Established interim compensating or mitigating controls programs |
• | Conducted supplemental training regarding the performance of key controls, including the retention of adequate supporting documentation for such controls |
We plan to continue to implement changes to the design of the controls over the affected processes and to ensure such controls function at an appropriate level as follows:
• | Implement system enhancements to provide timely and complete information in support of periodic control requirements and to reduce the reliance on manual processes |
• | Enhance the corporate finance management review controls that are relied upon to review multiple element revenue arrangements |
• | Provide continued and enhanced oversight until the material weaknesses are remediated |
As we continue to monitor the effectiveness of our internal control over financial reporting in the areas affected by the material weaknesses, we continue to perform additional procedures, including the use of manual mitigating control procedures where necessary, and have employed additional resources to provide assurance that our financial statements continue to be fairly stated in all material respects. As we continue to evaluate and improve our disclosure controls and procedures and internal control over financial reporting, we may determine that additional measures are necessary to address these control deficiencies or that a modification of certain of the remediation measures described above is appropriate. The identified material weaknesses in internal
40
controls will not be considered fully addressed until the internal controls over these areas have been in operation for a sufficient period of time for management to conclude that the material weaknesses have been fully remediated.
Internal Control over Financial Reporting
There has been no change in our internal control over financial reporting (as defined in Rules 13a-15(f) and 15d-15(f) under the Exchange Act) during our most recent fiscal quarter that has materially affected, or is reasonably likely to materially affect, our internal control over financial reporting.
41
NCI BUILDING SYSTEMS, INC.
PART II — OTHER INFORMATION
Item 1. Legal Proceedings.
See Part I, Item 1, “Unaudited Consolidated Financial Statements”, Note 17, which is incorporated herein by reference.
Item 1A. Risk Factors.
In addition to the other information set forth in this Quarterly Report on Form 10-Q, you should carefully consider the factors discussed in Part I, Item 1A, “Risk Factors” in our Annual Report on Form 10-K for the year ended October 30, 2016. The risks disclosed in our previous Annual Report on Form 10-K and information provided elsewhere in this report, could materially affect our business, financial condition or results of operations. Additional risks and uncertainties not currently known or we currently deem to be immaterial may materially adversely affect our business, financial condition or results of operations. We are providing the following information regarding changes that have occurred to previously disclosed risk factors from our Annual Report on Form 10-K for the year ended October 30, 2016. Except for such additional information, we believe there have been no material changes in our risk factors from those disclosed in our Annual Report on Form 10-K for the fiscal year ended October 30, 2016.
Changes in legislation, regulation and government policy as a result of the 2016 U.S. presidential and congressional elections may have a material effect on the Company’s business in the future.
The recent presidential and congressional elections in the United States could result in significant changes in, and uncertainty with respect to, legislation, regulation and government policy. While it is not possible to predict whether and when any such changes will occur, changes at the local, state or federal level could significantly impact the Company’s business. For example, the Company’s business activity levels are heavily influenced by the U.S. domestic economy and changes in administration policies may result in changes in tax rates and/or prevailing interest rates, which could either stimulate or contract activity levels in the domestic economy. More specifically, the Company has had a production facility in Mexico for approximately 20 years and purchases a material amount of manufactured products from this subsidiary. For example, in fiscal 2016, the Company imported approximately $53 million of metal building products from the Company’s Mexican subsidiary. Specific legislative and regulatory proposals discussed during and after the election that could have a material impact on us include, but are not limited to, reform of the U.S. federal tax code, including possible elimination of interest deduction and imposition of taxes on imports, and modifications to international trade policy. Any such changes, if unmitigated by changes in our supply chain or tax organization structures, may make it more difficult and/or more expensive for us and, thus, could have a material adverse effect on the Company’s results of operations and limit its growth.
We rely on third-party suppliers for materials in addition to steel, and if we fail to identify and develop relationships with a sufficient number of qualified suppliers, or if there is a significant interruption in our supply chains, our business and results of operations could be adversely affected.
In addition to steel, our operations require other raw materials from third-party suppliers. We generally have multiple sources of supply for our raw materials, however, in some cases, materials are provided by a single supplier. The loss of, or substantial decrease in the availability of, products from our suppliers, or the loss of a key supplier, could adversely impact our financial condition and results of operations. In addition, supply interruptions could arise from shortages of raw materials, labor disputes or weather conditions affecting products or shipments or other factors beyond our control. Short- and long-term disruptions in our supply chain would result in a need to maintain higher inventory levels as we replace similar product, a higher cost of product and ultimately a decrease in our revenues and profitability. To the extent our suppliers experience disruptions, there is a risk for delivery delays, production delays, production issues or delivery of non-conforming products by our suppliers. Even where these risks do not materialize, we may incur costs as we prepare contingency plans to address such risks. In addition, disruptions in transportation lines could delay our receipt of raw materials. If our supply of raw materials is disrupted or our delivery times extended, our results of operations and financial condition could be materially adversely affected. Furthermore, some of our third-party suppliers may not be able to handle commodity cost volatility or changing volumes while still performing up to our specifications. Short-term changes in the cost of these materials, some of which are subject to significant fluctuations, are sometimes, but not always passed on to our customers. Our inability to pass on material price increases to our customers could adversely impact our financial condition, operating results and cash flows.
42
Item 2. Unregistered Sales of Equity Securities and Use of Proceeds.
On September 8, 2016, our board of directors authorized a stock repurchase program for the repurchase of up to an aggregate of $50.0 million of the Company’s outstanding common stock. Under this repurchase program, the Company is authorized to repurchase shares, if at all, at times and in amounts that we deem appropriate in accordance with all applicable securities laws and regulations. Shares repurchased are usually retired. There is no time limit on the duration of the program.
During the second quarter of fiscal 2017, the Company did not have any stock repurchase activity. At April 30, 2017, approximately $39.9 million remains available for stock repurchases under the program.
Item 5. Other Information.
On June 6, 2017, Norman C. Chambers, the chairman of the board of directors and Chief Executive Officer, announced that he will resign as the Company’s Chief Executive Officer effective July 1, 2017. Donald R. Riley, NCI’s President since January 2016, and President of NCI’s Group Business Segment from December 2014 to January 2016, was appointed the Company’s Chief Executive Officer by the Board, effective July 1, 2017. Mr. Riley will assume the role of our Chief Executive Officer in addition to his position as our President. Additionally, our Board of Directors (i) increased the size of the Board to thirteen (13) directors, and (ii) appointed Mr. Riley as a Class III member of the Board to fill the newly created directorship resulting from the increase in the size of the Board to thirteen (13) directors as a member of the Executive Committee, effective on July 1, 2017. Norman C. Chambers will remain employed by the Company as its Executive Chairman of the Board, in accordance with the terms of the employment agreement, dated September 1, 2015, as amended, between Mr. Chambers and the Company.
Item 6. Exhibits.
Exhibits
Those exhibits required to be filed by Item 601 of Regulation S-K are listed in the Index to Exhibits immediately preceding the exhibits filed herewith and such listing is incorporated herein by reference.
43
SIGNATURE
Pursuant to the requirements of the Securities Exchange Act of 1934, the registrant has duly caused this report to be signed on its behalf by the undersigned thereunto duly authorized.
NCI BUILDING SYSTEMS, INC. | ||
Date: June 7, 2017 | By: | /s/ Mark E. Johnson |
Mark E. Johnson | ||
Executive Vice President, Chief Financial Officer | ||
and Treasurer | ||
Index to Exhibits
*31.1 | Rule 13a-14(a)/15d-14(a) Certifications (Section 302 of the Sarbanes-Oxley Act of 2002) | |
*31.2 | Rule 13a-14(a)/15d-14(a) Certifications (Section 302 of the Sarbanes-Oxley Act of 2002) | |
**32.1 | Certifications pursuant to Section 1350 of Chapter 63 of Title 18 of the United States Code (Section 906 of the Sarbanes-Oxley Act of 2002) | |
**32.2 | Certifications pursuant to Section 1350 of Chapter 63 of Title 18 of the United States Code (Section 906 of the Sarbanes-Oxley Act of 2002) | |
*101.INS | XBRL Instance Document | |
*101.SCH | XBRL Taxonomy Extension Schema Document | |
*101.CAL | XBRL Taxonomy Extension Calculation Linkbase Document | |
*101.DEF | XBRL Taxonomy Definition Linkbase Document | |
*101.LAB | XBRL Taxonomy Extension Label Linkbase Document | |
*101.PRE | XBRL Taxonomy Extension Presentation Linkbase Document | |
* | Filed herewith | |
** | Furnished herewith | |
Exhibit 31.1
CERTIFICATION PURSUANT TO RULE 13a-14(b)/15d-14(a)
I, Norman C. Chambers, certify that:
1. I have reviewed this quarterly report on Form 10-Q of NCI Building Systems, Inc.;
2. Based on my knowledge, this report does not contain any untrue statement of a material fact or omit to state a material fact necessary to make the statements made, in light of the circumstances under which such statements were made, not misleading with respect to the period covered by this report;
3. Based on my knowledge, the financial statements, and other financial information included in this report, fairly present in all material respects the financial condition, results of operations and cash flows of the registrant as of, and for, the periods presented in this report;
4. The registrant’s other certifying officer and I are responsible for establishing and maintaining disclosure controls and procedures (as defined in Exchange Act Rules 13a-15(e) and 15d-15(e)) and internal control over financial reporting (as defined in Exchange Act Rules 13a-15(f) and 15d-15(f)) for the registrant and have:
(a) Designed such disclosure controls and procedures, or caused such disclosure controls and procedures to be designed under our supervision, to ensure that material information relating to the registrant, including its consolidated subsidiaries, is made known to us by others within those entities, particularly during the period in which this report is being prepared;
(b) Designed such internal control over financial reporting, or caused such internal control over financial reporting to be designed under our supervision, to provide reasonable assurance regarding the reliability of financial reporting and the preparation of financial statements for external purposes in accordance with generally accepted accounting principles;
(c) Evaluated the effectiveness of the registrant’s disclosure controls and procedures and presented in this report our conclusions about the effectiveness of the disclosure controls and procedures, as of the end of the period covered by this report based on such evaluation; and
(d) Disclosed in this report any change in the registrant’s internal control over financial reporting that occurred during the registrant’s most recent fiscal quarter (the registrant’s fourth fiscal quarter in the case of an annual report) that has materially affected, or is reasonably likely to materially affect, the registrant’s internal control over financial reporting; and
5. The registrant’s other certifying officer and I have disclosed, based on our most recent evaluation of internal control over financial reporting, to the registrant’s auditors and the audit committee of the registrant’s board of directors (or persons performing the equivalent functions):
(a) All significant deficiencies and material weaknesses in the design or operation of internal control over financial reporting which are reasonably likely to adversely affect the registrant’s ability to record, process, summarize and report financial information; and
(b) Any fraud, whether or not material, that involves management or other employees who have a significant role in the registrant’s internal control over financial reporting.
Date: June 7, 2017
/s/ Norman C. Chambers | |
Norman C. Chambers | |
Chairman of the Board and Chief Executive Officer | |
(Principal Executive Officer) | |
Exhibit 31.2
CERTIFICATION PURSUANT TO RULE 13a-14(b)/15d-14(a)
I, Mark E. Johnson, certify that:
1. I have reviewed this quarterly report on Form 10-Q of NCI Building Systems, Inc.;
2. Based on my knowledge, this report does not contain any untrue statement of a material fact or omit to state a material fact necessary to make the statements made, in light of the circumstances under which such statements were made, not misleading with respect to the period covered by this report;
3. Based on my knowledge, the financial statements, and other financial information included in this report, fairly present in all material respects the financial condition, results of operations and cash flows of the registrant as of, and for, the periods presented in this report;
4. The registrant’s other certifying officer and I are responsible for establishing and maintaining disclosure controls and procedures (as defined in Exchange Act Rules 13a-15(e) and 15d-15(e)) and internal control over financial reporting (as defined in Exchange Act Rules 13a-15(f) and 15d-15(f)) for the registrant and have:
(a) Designed such disclosure controls and procedures, or caused such disclosure controls and procedures to be designed under our supervision, to ensure that material information relating to the registrant, including its consolidated subsidiaries, is made known to us by others within those entities, particularly during the period in which this report is being prepared;
(b) Designed such internal control over financial reporting, or caused such internal control over financial reporting to be designed under our supervision, to provide reasonable assurance regarding the reliability of financial reporting and the preparation of financial statements for external purposes in accordance with generally accepted accounting principles;
(c) Evaluated the effectiveness of the registrant’s disclosure controls and procedures and presented in this report our conclusions about the effectiveness of the disclosure controls and procedures, as of the end of the period covered by this report based on such evaluation; and
(d) Disclosed in this report any change in the registrant’s internal control over financial reporting that occurred during the registrant’s most recent fiscal quarter (the registrant’s fourth fiscal quarter in the case of an annual report) that has materially affected, or is reasonably likely to materially affect, the registrant’s internal control over financial reporting; and
5. The registrant’s other certifying officer and I have disclosed, based on our most recent evaluation of internal control over financial reporting, to the registrant’s auditors and the audit committee of the registrant’s board of directors (or persons performing the equivalent functions):
(a) All significant deficiencies and material weaknesses in the design or operation of internal control over financial reporting which are reasonably likely to adversely affect the registrant’s ability to record, process, summarize and report financial information; and
(b) Any fraud, whether or not material, that involves management or other employees who have a significant role in the registrant’s internal control over financial reporting.
Date: June 7, 2017
/s/ Mark E. Johnson | |
Mark E. Johnson | |
Executive Vice President, | |
Chief Financial Officer and Treasurer | |
(Principal Financial Officer) | |
Exhibit 32.1
CERTIFICATION PURSUANT TO
SECTION 906 OF THE SARBANES-OXLEY ACT
In connection with the quarterly report of NCI Building Systems, Inc. (the “Company”) for the quarter ended April 30, 2017 as filed with the Securities and Exchange Commission on the date hereof (the “Report”), I, Norman C. Chambers, Chief Executive Officer of the Company, hereby certify, pursuant to 18 U.S.C. Section 1350, as adopted pursuant to Section 906 of the Sarbanes-Oxley Act of 2002, that:
1. | I have reviewed this Report of the Company; | |
2. | This Report fully complies with the requirements of section 13(a) or 15(d) of the Securities Exchange Act of 1934; and | |
3. | The information contained in this Report fairly presents, in all material respects, the financial condition and results of operations of the Company. | |
Date: June 7, 2017
/s/ Norman C. Chambers | |
Norman C. Chambers | |
Chairman of the Board and Chief Executive Officer | |
(Principal Executive Officer) | |
A signed original of this written statement required by Section 906 has been provided to NCI Building Systems, Inc. and will be retained by NCI Building Systems, Inc. and furnished to the Securities and Exchange Commission or its staff upon request.
This Certification shall not be deemed to be “filed” or part of the Report or incorporated by reference into any of the registrant’s filings with the Securities and Exchange Commission by implication or by any reference in any such filing to the Report.
Exhibit 32.2
CERTIFICATION PURSUANT TO
SECTION 906 OF THE SARBANES-OXLEY ACT
SECTION 906 OF THE SARBANES-OXLEY ACT
In connection with the quarterly report of NCI Building Systems, Inc. (the “Company”) for the quarter ended April 30, 2017 as filed with the Securities and Exchange Commission on the date hereof (the “Report”), I, Mark E. Johnson, Chief Financial Officer of the Company, hereby certify, pursuant to 18 U.S.C. Section 1350, as adopted pursuant to Section 906 of the Sarbanes-Oxley Act of 2002, that:
1. | I have reviewed this Report of the Company; | |
2. | This Report fully complies with the requirements of section 13(a) or 15(d) of the Securities Exchange Act of 1934; and | |
3. | The information contained in this Report fairly presents, in all material respects, the financial condition and results of operations of the Company. | |
Date: June 7, 2017
/s/ Mark E. Johnson | |
Mark E. Johnson | |
Executive Vice President, | |
Chief Financial Officer and Treasurer | |
(Principal Financial Officer) | |
A signed original of this written statement required by Section 906 has been provided to NCI Building Systems, Inc. and will be retained by NCI Building Systems, Inc. and furnished to the Securities and Exchange Commission or its staff upon request.
This Certification shall not be deemed to be “filed” or part of the Report or incorporated by reference into any of the registrant’s filings with the Securities and Exchange Commission by implication or by any reference in any such filing to the Report.
Serious News for Serious Traders! Try StreetInsider.com Premium Free!
You May Also Be Interested In
- Notice of 2024 First Quarter Results Conference Call and Webcast for Investors and Analysts and Annual Meeting of Shareholders
- Garner Foods Announces Retirement of CEO, Ann Garner Riddle
- GMV Minerals Inc. Closes Non-Brokered Financing
Create E-mail Alert Related Categories
SEC FilingsSign up for StreetInsider Free!
Receive full access to all new and archived articles, unlimited portfolio tracking, e-mail alerts, custom newswires and RSS feeds - and more!
