The bond market this year has been characterized by the strength of quality holdings in the mortgage, treasury, municipal, and investment-grade corporate sectors. The combination of falling interest rates and desire for high grade assets to offset equity or other risk positions has been a tailwind for many aspects of the bond market.
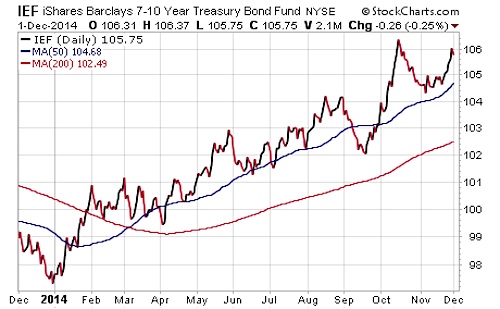
A look at a chart of the iShares 7-10 Year Treasury Bond ETF (IEF) shows just how consistent the trend has been over the last year. This key benchmark of intermediate-term Treasuries is now hovering near its highest levels of 2014 and has shown remarkable strength given that stocks are also sitting close to all-time highs.
IEF Daily Chart
While this trend has been widely publicized, another big shift in the bond market has largely flown under the radar this year.
That dynamic is the spread between short and intermediate-term interest rates, which is indicating a flattening yield curve. Essentially, investors are trading their short term debt for longer dated maturities in an effort to capitalize on gains from falling interest rates. This causes interest rates at the long end of the curve to fall faster, while short-term interest rates are steady or rising.
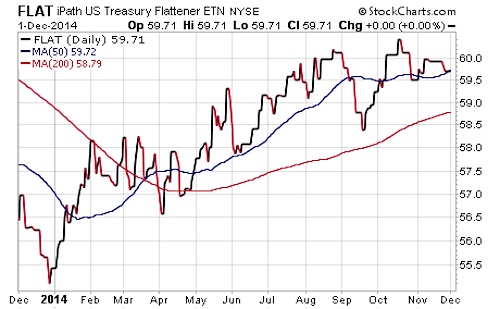
One vehicle that tracks this phenomenon is the iPath US Treasury Flattener ETN (FLAT), which seeks to provide inverse exposure to the Barclays US Treasury 2Y/10Y Yield Curve Index. Despite its small size and lack of liquidity, this unique ETN can provide a tracking measure for identifying shifts of this nature in the bond market. So far this year, FLAT has gained 7.71% and continues to indicate a compressed spread between 2 and 10-year treasury bonds.
FLAT Daily Chart
There is also an ETN to take advantage of a steepening yield curve in the iPath US Treasury Steepener ETN (STPP). This tool is designed to give you the exact opposite exposure as FLAT.
So what does this mean for your bond portfolio?
Essentially a flattening yield curve signals that bond investors continue to believe that prospects for economic growth remain anemic. In addition, it could be signaling that fixed-income investors are preparing for a 2015 rate hike from the Federal Reserve. The Fed’s benchmark rate typically has more impact on the short end of the curve on an immediate basis.
If this continues, short duration investment-grade bond ETFs and mutual funds may continue to show meager returns overall. While new investors on the short end of the curve are now able to capture a slightly increased income stream, those that have stuck with these funds have failed to capture any notable upside potential.
Follow Dave on Twitter: @fabiancapital
No position in any of the securities mentioned at the time of publication. Any opinions expressed herein are solely those of the author, and do not in any way represent the views or opinions of any other person or entity.
")


 Ready To Break Out?")
