
 Yahoo Finance
 Here's What Spirax-Sarco Engineering's (LON:SPX) Strong Returns On Capital Mean
Finding a business that has the potential to grow substantially is not easy, but it is possible if we look at a few key financial metrics. Firstly, we'd want to identify a growing return on capital employed (ROCE) and then alongside that, an ever-increasing base of capital employed. If you see this, it typically means it's a company with a great business model and plenty of profitable reinvestment opportunities. With that in mind, the ROCE of Spirax-Sarco Engineering (LON:SPX) looks attractive right now, so lets see what the trend of returns can tell us.
What is Return On Capital Employed (ROCE)?
For those that aren't sure what ROCE is, it measures the amount of pre-tax profits a company can generate from the capital employed in its business. To calculate this metric for Spirax-Sarco Engineering, this is the formula:
Return on Capital Employed = Earnings Before Interest and Tax (EBIT) ÷ (Total Assets - Current Liabilities)
0.22 = UK£320m ÷ (UK£1.9b - UK£382m) (Based on the trailing twelve months to December 2021).
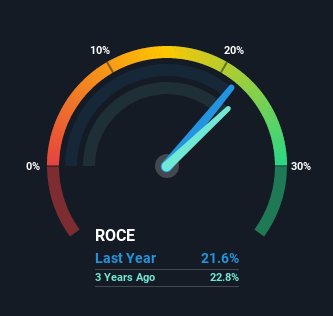
So, Spirax-Sarco Engineering has an ROCE of 22%. That's a fantastic return and not only that, it outpaces the average of 11% earned by companies in a similar industry.
See our latest analysis for Spirax-Sarco Engineering
In the above chart we have measured Spirax-Sarco Engineering's prior ROCE against its prior performance, but the future is arguably more important. If you'd like to see what analysts are forecasting going forward, you should check out our free report for Spirax-Sarco Engineering.
What Does the ROCE Trend For Spirax-Sarco Engineering Tell Us?
It's hard not to be impressed by Spirax-Sarco Engineering's returns on capital. Over the past five years, ROCE has remained relatively flat at around 22% and the business has deployed 110% more capital into its operations. With returns that high, it's great that the business can continually reinvest its money at such appealing rates of return. If Spirax-Sarco Engineering can keep this up, we'd be very optimistic about its future.
In Conclusion...
In summary, we're delighted to see that Spirax-Sarco Engineering has been compounding returns by reinvesting at consistently high rates of return, as these are common traits of a multi-bagger. And long term investors would be thrilled with the 173% return they've received over the last five years. So even though the stock might be more "expensive" than it was before, we think the strong fundamentals warrant this stock for further research.
If you want to continue researching Spirax-Sarco Engineering, you might be interested to know about the 1 warning sign that our analysis has discovered.
If you'd like to see other companies earning high returns, check out our free list of companies earning high returns with solid balance sheets here.
Have feedback on this article? Concerned about the content? Get in touch with us directly. Alternatively, email editorial-team (at) simplywallst.com.
This article by Simply Wall St is general in nature. We provide commentary based on historical data and analyst forecasts only using an unbiased methodology and our articles are not intended to be financial advice. It does not constitute a recommendation to buy or sell any stock, and does not take account of your objectives, or your financial situation. We aim to bring you long-term focused analysis driven by fundamental data. Note that our analysis may not factor in the latest price-sensitive company announcements or qualitative material. Simply Wall St has no position in any stocks mentioned.
