BT Group plc (LON:BT.A): Time For A Financial Health Check

Investors pursuing a solid, dependable stock investment can often be led to BT Group plc (LSE:BT.A), a large-cap worth UK£23.96B. Risk-averse investors who are attracted to diversified streams of revenue and strong capital returns tend to seek out these large companies. But, the health of the financials determines whether the company continues to succeed. Today we will look at BT Group’s financial liquidity and debt levels, which are strong indicators for whether the company can weather economic downturns or fund strategic acquisitions for future growth. Remember this is a very top-level look that focuses exclusively on financial health, so I recommend a deeper analysis into BT.A here. View our latest analysis for BT Group
Does BT.A produce enough cash relative to debt?
Over the past year, BT.A has reduced its debt from UK£14.76B to UK£12.71B , which is made up of current and long term debt. With this debt repayment, BT.A’s cash and short-term investments stands at UK£2.05B , ready to deploy into the business. On top of this, BT.A has produced cash from operations of UK£6.17B in the last twelve months, resulting in an operating cash to total debt ratio of 48.56%, signalling that BT.A’s operating cash is sufficient to cover its debt. This ratio can also be interpreted as a measure of efficiency as an alternative to return on assets. In BT.A’s case, it is able to generate 0.49x cash from its debt capital.
Does BT.A’s liquid assets cover its short-term commitments?
Looking at BT.A’s most recent UK£10.93B liabilities, it seems that the business has not maintained a sufficient level of current assets to meet its obligations, with the current ratio last standing at 0.63x, which is below the prudent industry ratio of 3x.
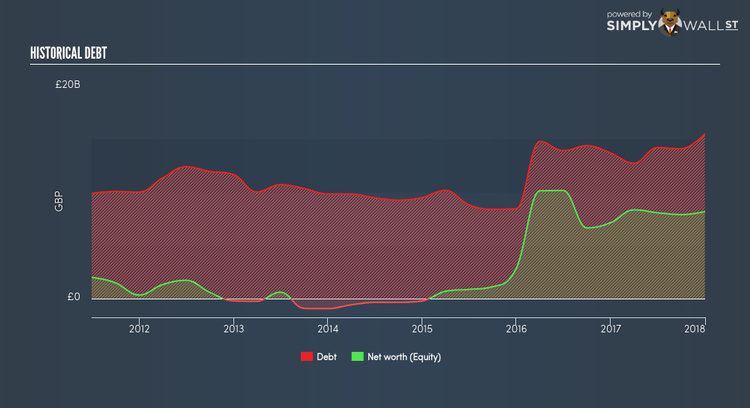
Is BT.A’s debt level acceptable?
With total debt exceeding equities, BT Group is considered a highly levered company. This isn’t uncommon for large companies because interest payments on debt are tax deductible, meaning debt can be a cheaper source of capital than equity. Accordingly, large companies often have lower cost of capital due to easily obtained financing, providing an advantage over smaller companies. No matter how high the company’s debt, if it can easily cover the interest payments, it’s considered to be efficient with its use of excess leverage. A company generating earnings before interest and tax (EBIT) at least three times its net interest payments is considered financially sound. For BT.A, the ratio of 7.19x suggests that interest is well-covered. Strong interest coverage is seen as a responsible and safe practice, which highlights why most investors believe large-caps such as BT.A is a safe investment.
Next Steps:
Although BT.A’s debt level is towards the higher end of the spectrum, its cash flow coverage seems adequate to meet debt obligations which means its debt is being efficiently utilised. Though its lack of liquidity raises questions over current asset management practices for the large-cap. Keep in mind I haven’t considered other factors such as how BT.A has been performing in the past. I recommend you continue to research BT Group to get a better picture of the stock by looking at:
Future Outlook: What are well-informed industry analysts predicting for BT.A’s future growth? Take a look at our free research report of analyst consensus for BT.A’s outlook.
Valuation: What is BT.A worth today? Is the stock undervalued, even when its growth outlook is factored into its intrinsic value? The intrinsic value infographic in our free research report helps visualize whether BT.A is currently mispriced by the market.
Other High-Performing Stocks: Are there other stocks that provide better prospects with proven track records? Explore our free list of these great stocks here.
To help readers see pass the short term volatility of the financial market, we aim to bring you a long-term focused research analysis purely driven by fundamental data. Note that our analysis does not factor in the latest price sensitive company announcements.
The author is an independent contributor and at the time of publication had no position in the stocks mentioned.
