Brent Crude Oil Price Update – Six-Day Consolidation Suggests Investor Indecision, Impending Volatility
Crude oil prices are trading slightly better early Monday, likely underpinned by a positive trade in the global equity markets and a report from Friday that showed U.S. drilling activity fell to its lowest level in about two months. Nonetheless, capping the market are increasing concerns about a weaker global economy and worries over lower demand.
At 0454 GMT, February Brent crude oil futures are trading $60.32, up $0.04 or +0.07%.
Daily Swing Chart Technical Analysis
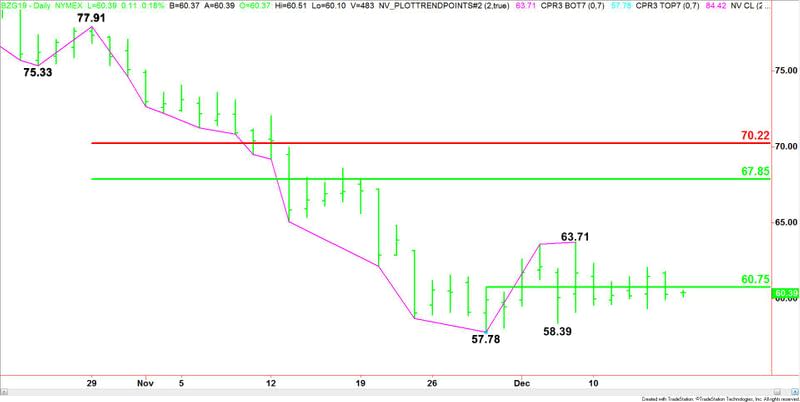
Unlike its U.S. counterpart, WTI crude oil, the main trend is down according to the Brent crude oil daily futures chart. However, momentum has been trending higher since the formation of the closing price reversal bottom at $57.78 on November 29.
A trade through $57.78 will negate the closing price reversal bottom and signal a resumption of the downtrend.
The minor trend is up. This is another reason why the momentum is trending higher. A trade through $63.71 will reaffirm the uptrend on the minor swing chart. A trade through $58.39 will change the minor trend to down. This will shift momentum back to the downside.
The minor range is $57.78 to $63.71. Its 50% level or pivot at $60.75 has been controlling the direction of the market since December 7.
The main range is $77.91 to $57.78. If a move over $63.71 can spark a breakout then its retracement zone at $67.85 to $70.22 will become the primary upside target.
Daily Swing Chart Technical Forecast
Based on the price action over the past few weeks, the direction of the February Brent crude oil market on Monday is likely to be determined by trader reaction to the minor pivot at $60.75.
Bullish Scenario
Overtaking and sustaining a rally over $60.75 will indicate the presence of buyers. Taking out the high from December 13 at $62.02 will indicate the buying is getting stronger. If this can generate enough upside momentum then look for the rally to extend into the minor high at $63.71.
The daily chart indicates there is plenty of room to the upside over $63.71 so treat this price as a potential trigger point for an acceleration to the upside.
Bearish Scenario
A sustained move under $60.75 will signal the presence of sellers. Look for a potential spike to the downside if the December 13 low at $59.34 is taken out with conviction. This could lead to a retest of the minor bottom at $58.39, followed closely by the main bottom at $57.78.
This article was originally posted on FX Empire
