Is BT Group plc (LON:BT.A) Better Than Average At Deploying Capital?

Today we’ll look at BT Group plc (LON:BT.A) and reflect on its potential as an investment. In particular, we’ll consider its Return On Capital Employed (ROCE), as that can give us insight into how profitably the company is able to employ capital in its business.
First, we’ll go over how we calculate ROCE. Second, we’ll look at its ROCE compared to similar companies. Last but not least, we’ll look at what impact its current liabilities have on its ROCE.
What is Return On Capital Employed (ROCE)?
ROCE measures the ‘return’ (pre-tax profit) a company generates from capital employed in its business. Generally speaking a higher ROCE is better. In brief, it is a useful tool, but it is not without drawbacks. Author Edwin Whiting says to be careful when comparing the ROCE of different businesses, since ‘No two businesses are exactly alike.’
How Do You Calculate Return On Capital Employed?
The formula for calculating the return on capital employed is:
Return on Capital Employed = Earnings Before Interest and Tax (EBIT) ÷ (Total Assets – Current Liabilities)
Or for BT Group:
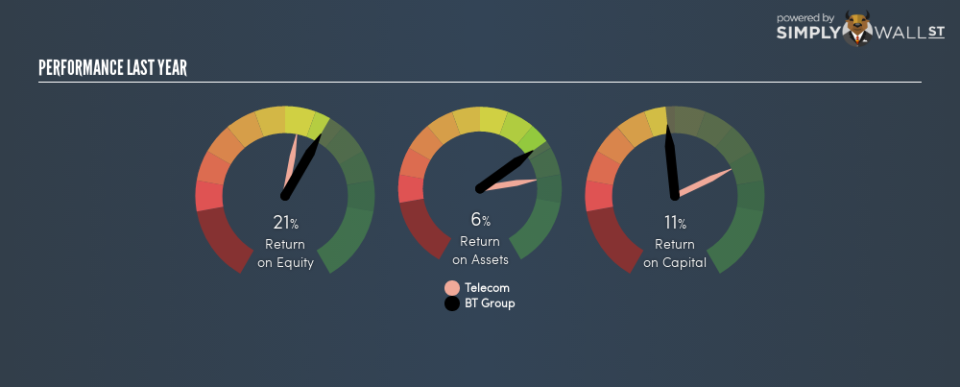
0.11 = UK£3.8b ÷ (UK£45b – UK£11b) (Based on the trailing twelve months to September 2018.)
So, BT Group has an ROCE of 11%.
See our latest analysis for BT Group
Is BT Group’s ROCE Good?
ROCE can be useful when making comparisons, such as between similar companies. Using our data, BT Group’s ROCE appears to be around the 11% average of the Telecom industry. Regardless of where BT Group sits next to its industry, its ROCE in absolute terms appears satisfactory, and this company could be worth a closer look.
BT Group’s current ROCE of 11% is lower than 3 years ago, when the company reported a 20% ROCE. So investors might consider if it has had issues recently.
It is important to remember that ROCE shows past performance, and is not necessarily predictive. Companies in cyclical industries can be difficult to understand using ROCE, as returns typically look high during boom times, and low during busts. ROCE is, after all, simply a snap shot of a single year. Future performance is what matters, and you can see analyst predictions in our free report on analyst forecasts for the company.
Do BT Group’s Current Liabilities Skew Its ROCE?
Liabilities, such as supplier bills and bank overdrafts, are referred to as current liabilities if they need to be paid within 12 months. The ROCE equation subtracts current liabilities from capital employed, so a company with a lot of current liabilities appears to have less capital employed, and a higher ROCE than otherwise. To check the impact of this, we calculate if a company has high current liabilities relative to its total assets.
BT Group has total liabilities of UK£11b and total assets of UK£45b. As a result, its current liabilities are equal to approximately 24% of its total assets. Low current liabilities are not boosting the ROCE too much.
What We Can Learn From BT Group’s ROCE
With that in mind, BT Group’s ROCE appears pretty good. Of course you might be able to find a better stock than BT Group. So you may wish to see this free collection of other companies that have grown earnings strongly.
If you like to buy stocks alongside management, then you might just love this free list of companies. (Hint: insiders have been buying them).
To help readers see past the short term volatility of the financial market, we aim to bring you a long-term focused research analysis purely driven by fundamental data. Note that our analysis does not factor in the latest price-sensitive company announcements.
The author is an independent contributor and at the time of publication had no position in the stocks mentioned. For errors that warrant correction please contact the editor at editorial-team@simplywallst.com.
