
 Yahoo Finance
 Here's What Lloyds Banking Group plc's (LON:LLOY) P/E Is Telling Us

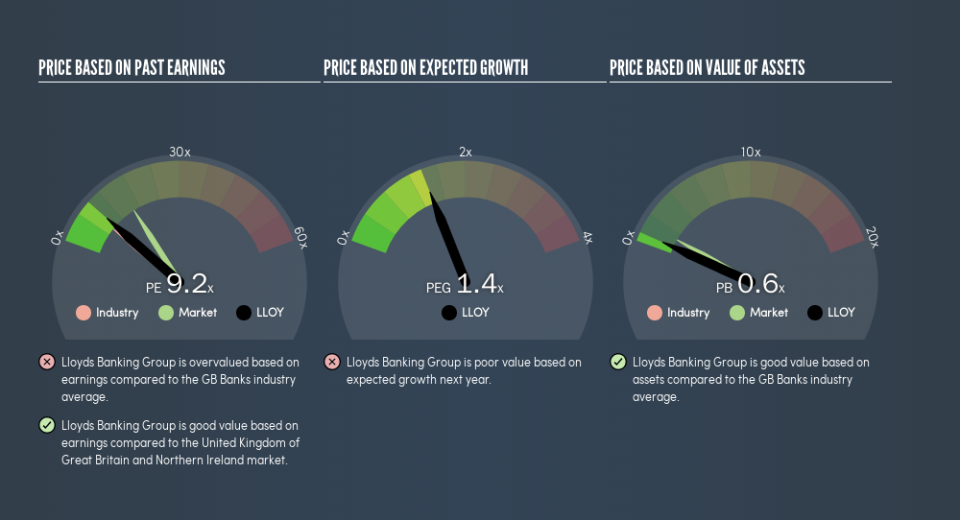
This article is for investors who would like to improve their understanding of price to earnings ratios (P/E ratios). We'll look at Lloyds Banking Group plc's (LON:LLOY) P/E ratio and reflect on what it tells us about the company's share price. Lloyds Banking Group has a P/E ratio of 9.17, based on the last twelve months. In other words, at today's prices, investors are paying £9.17 for every £1 in prior year profit.
View our latest analysis for Lloyds Banking Group
How Do You Calculate Lloyds Banking Group's P/E Ratio?
The formula for price to earnings is:
Price to Earnings Ratio = Price per Share ÷ Earnings per Share (EPS)
Or for Lloyds Banking Group:
P/E of 9.17 = £0.50 ÷ £0.054 (Based on the year to June 2019.)
Is A High Price-to-Earnings Ratio Good?
A higher P/E ratio implies that investors pay a higher price for the earning power of the business. That isn't a good or a bad thing on its own, but a high P/E means that buyers have a higher opinion of the business's prospects, relative to stocks with a lower P/E.
Does Lloyds Banking Group Have A Relatively High Or Low P/E For Its Industry?
One good way to get a quick read on what market participants expect of a company is to look at its P/E ratio. As you can see below, Lloyds Banking Group has a higher P/E than the average company (7.9) in the banks industry.
That means that the market expects Lloyds Banking Group will outperform other companies in its industry. Shareholders are clearly optimistic, but the future is always uncertain. So further research is always essential. I often monitor director buying and selling.
How Growth Rates Impact P/E Ratios
Generally speaking the rate of earnings growth has a profound impact on a company's P/E multiple. Earnings growth means that in the future the 'E' will be higher. And in that case, the P/E ratio itself will drop rather quickly. And as that P/E ratio drops, the company will look cheap, unless its share price increases.
Lloyds Banking Group shrunk earnings per share by 7.6% last year. But over the longer term (3 years), earnings per share have increased by 38%.
A Limitation: P/E Ratios Ignore Debt and Cash In The Bank
One drawback of using a P/E ratio is that it considers market capitalization, but not the balance sheet. Thus, the metric does not reflect cash or debt held by the company. Theoretically, a business can improve its earnings (and produce a lower P/E in the future) by investing in growth. That means taking on debt (or spending its cash).
Spending on growth might be good or bad a few years later, but the point is that the P/E ratio does not account for the option (or lack thereof).
Lloyds Banking Group's Balance Sheet
Net debt totals 76% of Lloyds Banking Group's market cap. This is enough debt that you'd have to make some adjustments before using the P/E ratio to compare it to a company with net cash.
The Verdict On Lloyds Banking Group's P/E Ratio
Lloyds Banking Group's P/E is 9.2 which is below average (16.1) in the GB market. The P/E reflects market pessimism that probably arises from the lack of recent EPS growth, paired with significant leverage.
When the market is wrong about a stock, it gives savvy investors an opportunity. If it is underestimating a company, investors can make money by buying and holding the shares until the market corrects itself. So this free visualization of the analyst consensus on future earnings could help you make the right decision about whether to buy, sell, or hold.
Of course, you might find a fantastic investment by looking at a few good candidates. So take a peek at this free list of companies with modest (or no) debt, trading on a P/E below 20.
We aim to bring you long-term focused research analysis driven by fundamental data. Note that our analysis may not factor in the latest price-sensitive company announcements or qualitative material.
If you spot an error that warrants correction, please contact the editor at editorial-team@simplywallst.com. This article by Simply Wall St is general in nature. It does not constitute a recommendation to buy or sell any stock, and does not take account of your objectives, or your financial situation. Simply Wall St has no position in the stocks mentioned. Thank you for reading.
