


EURGBP price, charts and analysis:
- EURGBP is at a critical point, poised to break through long-term trendline resistance.
- If it succeeds, sharp gains are possible.
Our trading forecasts for Q3 have just been published; you can find them here.
And check out the IG Client Sentiment data to help you trade profitably.
EURGBP upside in focus
The EURGBP cross now looks ready to break to the upside through resistance at a downward-sloping trendline connecting the lower highs in place since October last year.
EURGBP Price Chart, Daily Timeframe (August 17, 2017 to July 18, 2018)
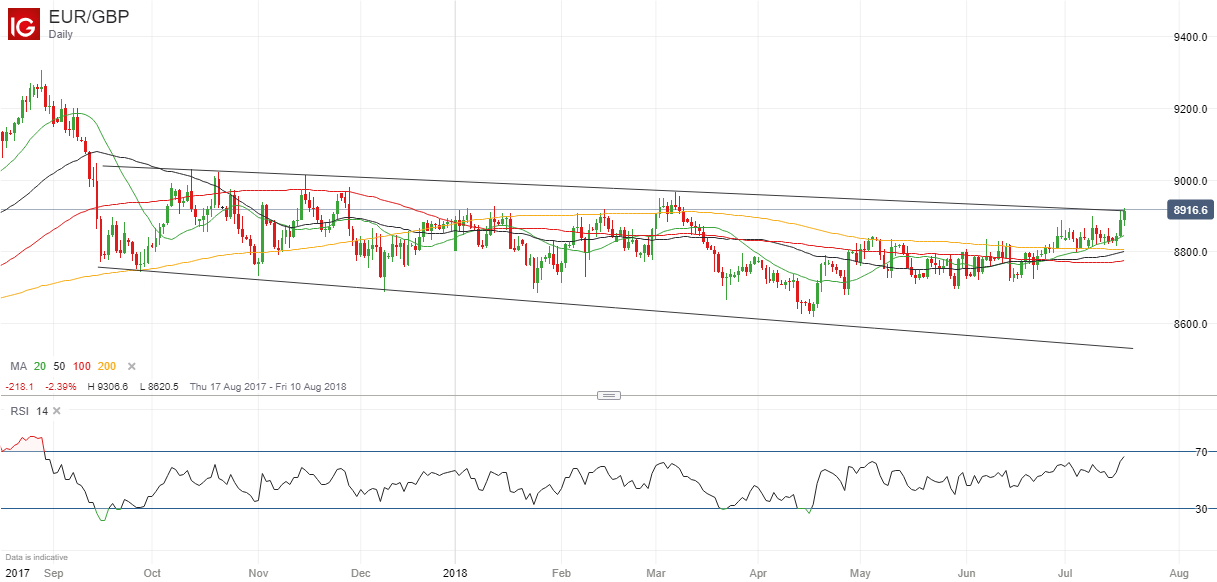
Having already nudged above the trendline, a close above it would be ideal to confirm a breakout. If it does, that would bring the March 7 high at 0.8968 into focus, with the 0.90 “round number” and then the high on November 15 last year, at 0.9015, the next targets after that.
Note the price is already above the 20-day, 50-day, 100-day and 200-day moving averages and that the 14-day relative strength index (RSI) is also moving higher – confirming the upmove – but is not yet in overbought territory above 70.
Meanwhile, those four moving averages are now providing support between 0.8776 and 0.8844, potentially blocking any strong move downwards.
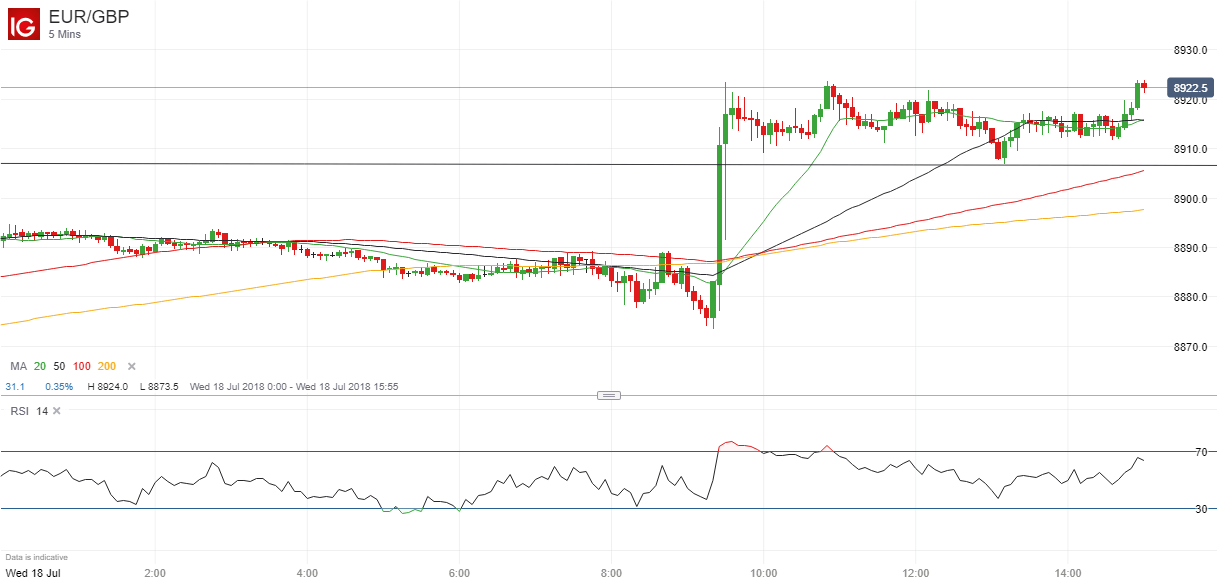
From a fundamental perspective, the latest move higher has been prompted by a weak British Pound in the wake of continued political turmoil in the UK over Brexit and lower-than-expected UK inflation data, the impact of which can be seen clearly on the five-minute chart.
EURGBP Price Chart, Five-Minute Timeframe (July 18, 2018)
Bullish signal from trader sentiment data
As for trader sentiment, retail trader data show 27.6% of traders are net-long EURGBP, with the ratio of traders short to long at 2.62 to 1. In fact, traders have remained net-short since June 15, when EURGBP traded near 0.88007; the price has moved 1.4% higher since then. The number of traders net-long is 12.0% lower than yesterday and 12.4% lower than last week, while the number of traders net-short is 15.8% higher than yesterday and 20.9% higher than last week.
At DailyFX, we typically take a contrarian view to crowd sentiment, and the fact traders are net-short suggests EURGBP may continue to rise. Traders are further net-short than yesterday and last week, and the combination of current sentiment and recent changes gives us a stronger EURGBP-bullish contrarian trading bias.
Resources to help you trade the forex markets
Whether you are a new or an experienced trader, at DailyFX we have many resources to help you: analytical and educational webinars hosted several times per day, trading guides to help you improve your trading performance, and one specifically for those who are new to forex. You can learn how to trade like an expert by reading our guide to the Traits of Successful Traders.
--- Written by Martin Essex, Analyst and Editor
Feel free to contact me via the comments section below, via email at martin.essex@ig.com or on Twitter @MartinSEssex


