
 Yahoo Finance
 Why Is Royal Caribbean (RCL) Down 1.8% Since its Last Earnings Report?

A month has gone by since the last earnings report for Royal Caribbean Cruises Ltd. RCL. Shares have lost about 1.8% in that time frame, outperforming the market.
Will the recent negative trend continue leading up to its next earnings release, or is RCL due for a breakout? Before we dive into how investors and analysts have reacted of late, let's take a quick look at its most recent earnings report in order to get a better handle on the important drivers.
Royal Caribbean Beats Q4 Estimates on Both Counts
Royal Caribbean Cruises posted better-than-expected fourth-quarter 2017 results. Adjusted earnings of $1.34 per share surpassed the Zacks Consensus Estimate of $1.20 by 11.7% and grew 8.9% year over year on the back of higher revenues and lower fuel costs. The bottom line came in ahead of the guided range of $1.15-$1.20.
Total revenues of $2 billion beat the consensus mark of $1.98 billion by $29 million, up 4.9% from the year-ago quarter. This upside is driven by higher passenger ticket as well as onboard and other revenues.
Quarterly Highlights
Passenger ticket revenues were up 4.9% to $1.42 billion and onboard and other revenues increased 5.2% to $584.1 million.
On a constant currency basis, net yields rose 3.9% year over year, surpassing the mid-point of the guided range by 165 basis points (bps). This improvement came on the back of strong close-in demand for core products and better-than-expected onboard spend.
Net cruise costs (NCC) excluding fuel, grew 8.7% on a constant currency basis, more than management’s expectation of 8.5% increase. Notably, the rise in costs was mainly due to planned investments and relief efforts for the hurricanes.
Total cruise operating expenses inched up 2% year over year to nearly $1.15 billion, mainly due to growing food, Commissions, transportation, onboard and other plus payroll and related operating costs. This was however, partly offset by decreased fuel and other operating expenses.
1Q18 Guidance
For the first quarter of 2018, Royal Caribbean expects adjusted earnings per share at roughly 95 cents, lower than the Zacks Consensus Estimate of 98 cents.
Constant-currency net yields are projected in the range of 3-3.5% increase. NCC excluding fuel is likely to be up about 10% at constant currency.
2018 Guidance
For 2018, the company anticipates earnings in the band of $8.55-$8.75 per share. The mid-point of this guided range is higher than the Zacks Consensus Estimate of $8.57.
The company expects net yields in the band of 1.5-3.5% on a constant currency basis.
NCC excluding fuel on a constant-currency basis is expected to be up 1.5-2%. Meanwhile, management noted to have been experiencing strong early booking trends for 2018.
How Have Estimates Been Moving Since Then?
It turns out, fresh estimate flatlined during the past month. There have been two revisions higher for the current quarter compared to two lower.
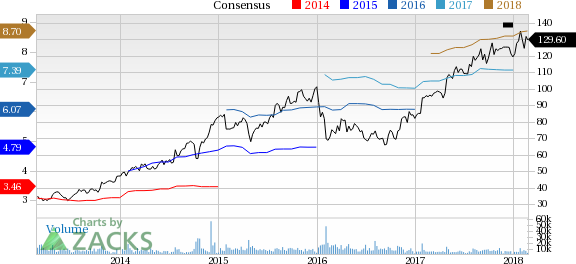
Royal Caribbean Cruises Ltd. Price and Consensus
Royal Caribbean Cruises Ltd. Price and Consensus | Royal Caribbean Cruises Ltd. Quote
VGM Scores
At this time, RCL has an average Growth Score of C, however its Momentum is doing a lot better with an A. However, the stock was allocated a grade of C on the value side, putting it in the middle 20% for this investment strategy.
Overall, the stock has an aggregate VGM Score of B. If you aren't focused on one strategy, this score is the one you should be interested in.
Based on our scores, the stock is more suitable for momentum investors than those looking for value and growth.
Outlook
RCL has a Zacks Rank #3 (Hold). We expect in-line returns from the stock in the next few months.
Want the latest recommendations from Zacks Investment Research? Today, you can download 7 Best Stocks for the Next 30 Days. Click to get this free report
Royal Caribbean Cruises Ltd. (RCL) : Free Stock Analysis Report
To read this article on Zacks.com click here.
Zacks Investment Research
