Is bluebird bio Inc’s (NASDAQ:BLUE) Liquidity Good Enough?

Small and large cap stocks are widely popular for a variety of reasons, however, mid-cap companies such as bluebird bio Inc (NASDAQ:BLUE), with a market cap of US$8.75B, often get neglected by retail investors. While they are less talked about as an investment category, mid-cap risk-adjusted returns have generally been better than more commonly focused stocks that fall into the small- or large-cap categories. Let’s take a look at BLUE’s debt concentration and assess their financial liquidity to get an idea of their ability to fund strategic acquisitions and grow through cyclical pressures. Remember this is a very top-level look that focuses exclusively on financial health, so I recommend a deeper analysis into BLUE here. Check out our latest analysis for bluebird bio
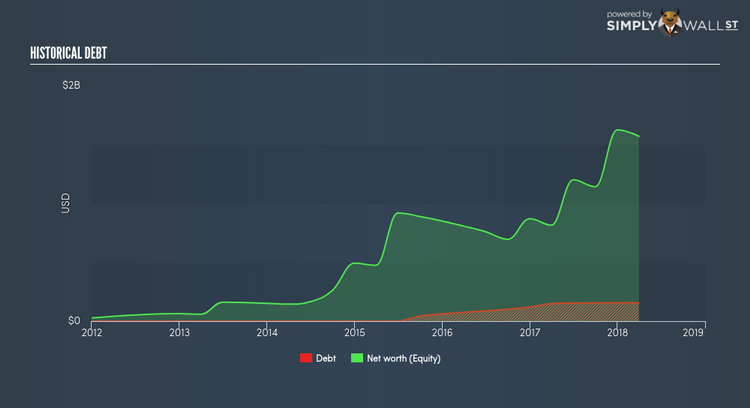
How does BLUE’s operating cash flow stack up against its debt?
Over the past year, BLUE has ramped up its debt from US$120.14M to US$155.80M made up of predominantly near term debt. With this growth in debt, the current cash and short-term investment levels stands at US$1.29B , ready to deploy into the business. Moving onto cash from operations, its operating cash flow is not yet significant enough to calculate a meaningful cash-to-debt ratio, indicating that operational efficiency is something we’d need to take a look at. For this article’s sake, I won’t be looking at this today, but you can examine some of BLUE’s operating efficiency ratios such as ROA here.
Does BLUE’s liquid assets cover its short-term commitments?
At the current liabilities level of US$95.61M liabilities, the company has been able to meet these commitments with a current assets level of US$1.32B, leading to a 13.83x current account ratio. However, anything above 3x is considered high and could mean that BLUE has too much idle capital in low-earning investments.
Does BLUE face the risk of succumbing to its debt-load?
With debt at 9.91% of equity, BLUE may be thought of as having low leverage. This range is considered safe as BLUE is not taking on too much debt obligation, which may be constraining for future growth. Risk around debt is extremely low for BLUE, and the company also has the ability and headroom to increase debt if needed going forward.
Next Steps:
Although BLUE’s debt level is relatively low, its cash flow levels still could not copiously cover its borrowings. This may indicate room for improvement in terms of its operating efficiency. However, the company exhibits an ability to meet its near term obligations should an adverse event occur. Keep in mind I haven’t considered other factors such as how BLUE has been performing in the past. I suggest you continue to research bluebird bio to get a better picture of the stock by looking at:
Future Outlook: What are well-informed industry analysts predicting for BLUE’s future growth? Take a look at our free research report of analyst consensus for BLUE’s outlook.
Valuation: What is BLUE worth today? Is the stock undervalued, even when its growth outlook is factored into its intrinsic value? The intrinsic value infographic in our free research report helps visualize whether BLUE is currently mispriced by the market.
Other High-Performing Stocks: Are there other stocks that provide better prospects with proven track records? Explore our free list of these great stocks here.
To help readers see pass the short term volatility of the financial market, we aim to bring you a long-term focused research analysis purely driven by fundamental data. Note that our analysis does not factor in the latest price sensitive company announcements.
The author is an independent contributor and at the time of publication had no position in the stocks mentioned.
