


Covid-19, Hong Kong Security Law, US-China Trade War, S&P500, USD/JPY – Talking Points:
- Upbeat Chinese PMI data fuelled sentiment early in Asia-Pacific trade.
- S&P 500consolidating at key resistance as Hong Kong’s security law escalates tensions between the US and China
- USD/JPY eyeing the 200-day moving average as it looks to extend its 5-day rally
Asia-Pacific Recap
A broad risk-on tilt was seen early in Asia-Pacific trade as upbeat Chinese PMI data nudged the trade-sensitive Australian Dollar higher against its US counterpart. S&P 500 futures remained relatively unchanged despite better-than-expected pending home sales figures overnight.
The haven-associated US Dollar and Japanese Yen drifted lower before pegging back lost ground, as the closing bell sounded for the Australian session. Gold held steady at $1,770 whilst yields on US 5-year Treasuries fell to a record low of 0.271% as the Federal Reserve considers replicating the Reserve Bank of Australia’s take on Yield Curve Control (YCC).
Looking forward, focus will remain fixated on Treasury Secretary Steven Mnuchin and Federal Reserve Chair Jerome Powell’s testimony in front of the House Financial Services Committee, with any inkling of further stimulus measures being introduced possibly stoking market appetite for risk.
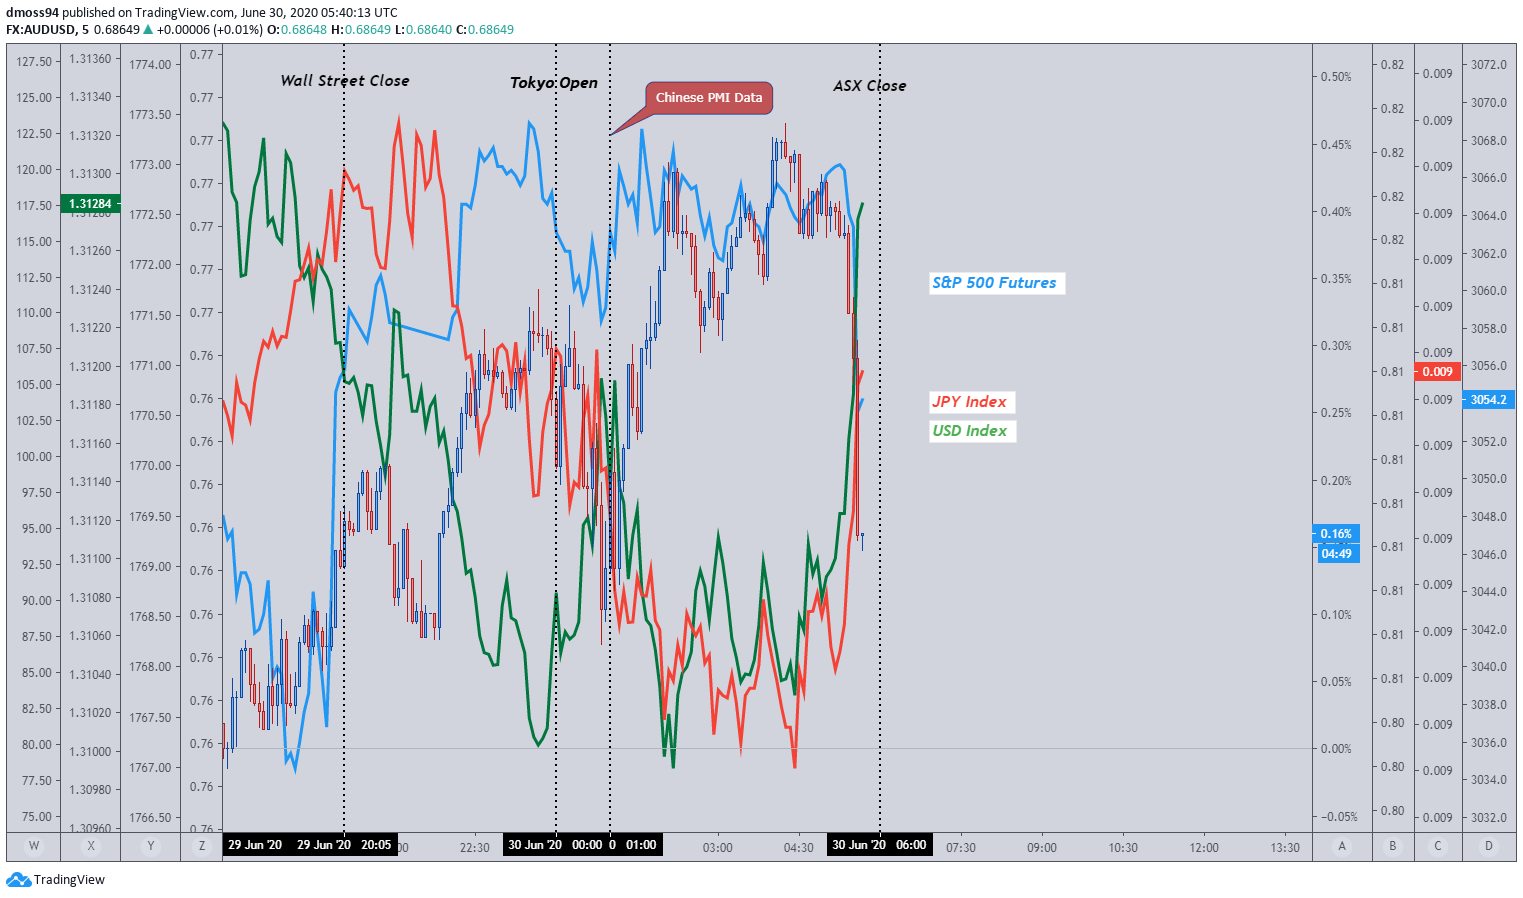
Source - TradingView
Coronavirus Headlines Continue to Dictate Sentiment
Warning shots fired by the head of the World Health Organization (WHO) that the “worst is yet to come” may continue to drain the positivity from financial markets as global cases of coronavirus blast past 10 million, resulting in over 500,000 deaths.
The deteriorating situation in the United States continues to weigh on risk appetite as Houston, the second-most populous city in Texas, reported ICU beds were 5% shy of capacity whilst Arizona re-instated restrictions on bars, gyms and theatres.
The notion that Covid-19 may be seasonal in nature seems all but debunked as cases continue to climb during the summer months, suggesting that a complete lifting of restrictions may not occur until the introduction of an effective vaccine.
To that end, global asset prices may come under pressure as investors begin to question whether the recovery has extended beyond the fundamentals.
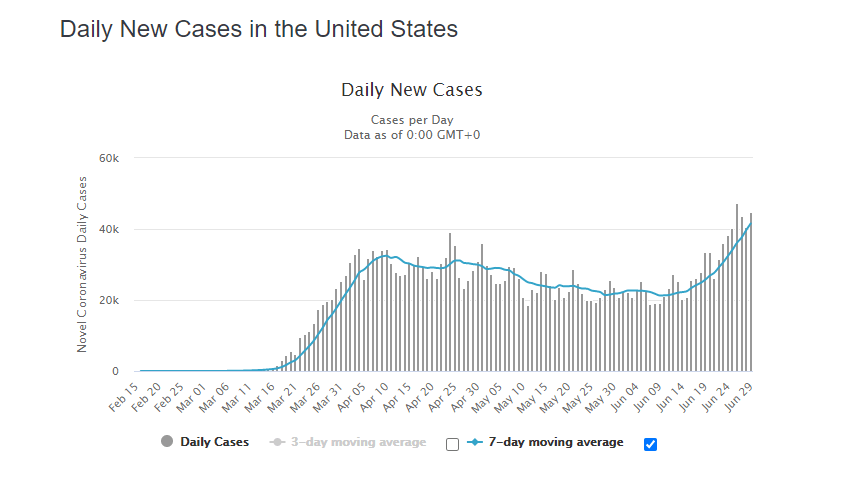
Source – Worldometer

Hong Kong Security Law Stokes US-China Tensions
The National People’s Congress Standing Committee (NPCSC) may have escalated tensions between the world’s two biggest economies after voting unanimously to approve the controversial National Security Law one day before the anniversary of Hong Kong’s return to Chinese rule.
Adoption of this law essentially allows Beijing to override the local judicial system in Hong Kong, eroding the autonomy of the special administrative region’s (SAR) ‘one country, two system’ principle of governance that has granted it special trade status with the United States.
Given the Trump administration’s pre-emptive action to restrict US exports of defence equipment and high-tech products on Monday, further measures are almost guaranteed with the President hinting at the cessation of the extradition treaty with Hong Kong along with the cancellation of visas for Chinese students and researchers with ties to the military.
Furthermore, Hong Kong Chief Executive Carrie Lam’s defiance that “sanctions will not scare us” and that “China will take countermeasures when needed” all but assures a period of sustained tit-for-tat exchanges, possibly fueling a surge of risk aversion and discounting of risk-associated assets.
S&P 500 Daily Chart – Descending Triangle Forming at Key Resistance
Source – TradingView
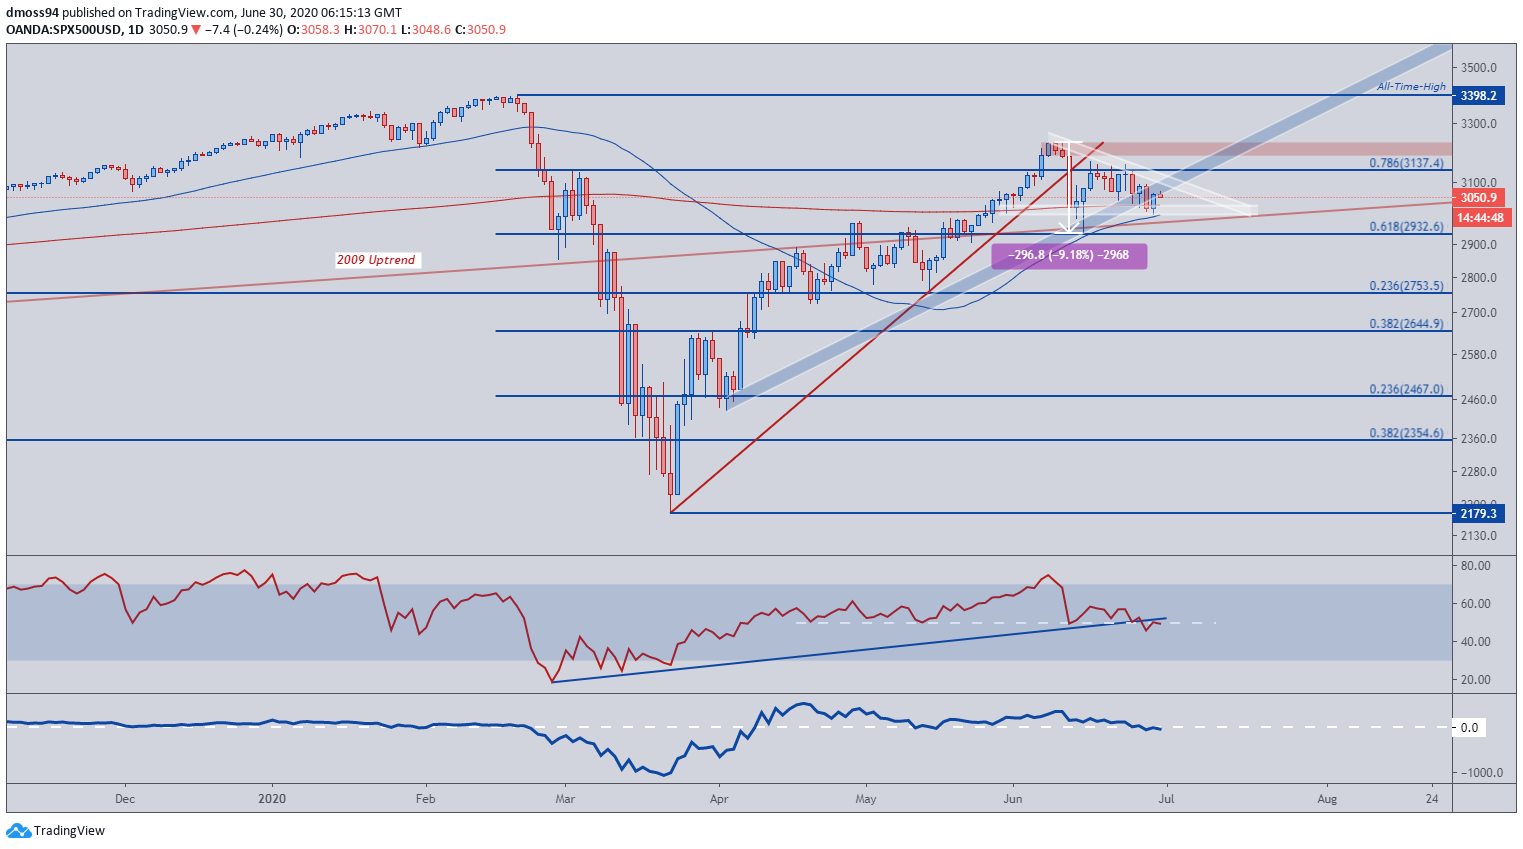
End of month flows along with a shortened trading week has seen the S&P500 consolidate into a possible Descending Triangle formation after price collapsed through the uptrend from the yearly low (2,179) on June 11.
The sudden 9% fall from the June high (3,233) pushed the benchmark index back to key supportive confluence at the 61.8% Fibonacci (2,933), 50-day moving average (2,916) and 2009 uptrend.
This sharp correction presented the opportunity to perhaps ‘buy the dip’, allowing price to tentatively recover back above the psychological 3,000-level.
The outlook remains constructive as price hold above 3,000, which may continue to encourage buyers as the overlap between the 50- and 200-MA provides a supportive safety net for the US benchmark index.
However, further gains seem to be limited by substantial resistance at the 78.6% Fibonacci (3,137) and the waning momentum seen on both technical indicators.
To that end, selling pressure may intensify if price can clear support at the 61.8% Fibonacci (2,932) and carve a path back to the May low (2,766) and 38.2% Fibonacci (2,645).
| Change in | Longs | Shorts | OI |
| Daily | 6% | -5% | 1% |
| Weekly | 7% | -10% | -2% |
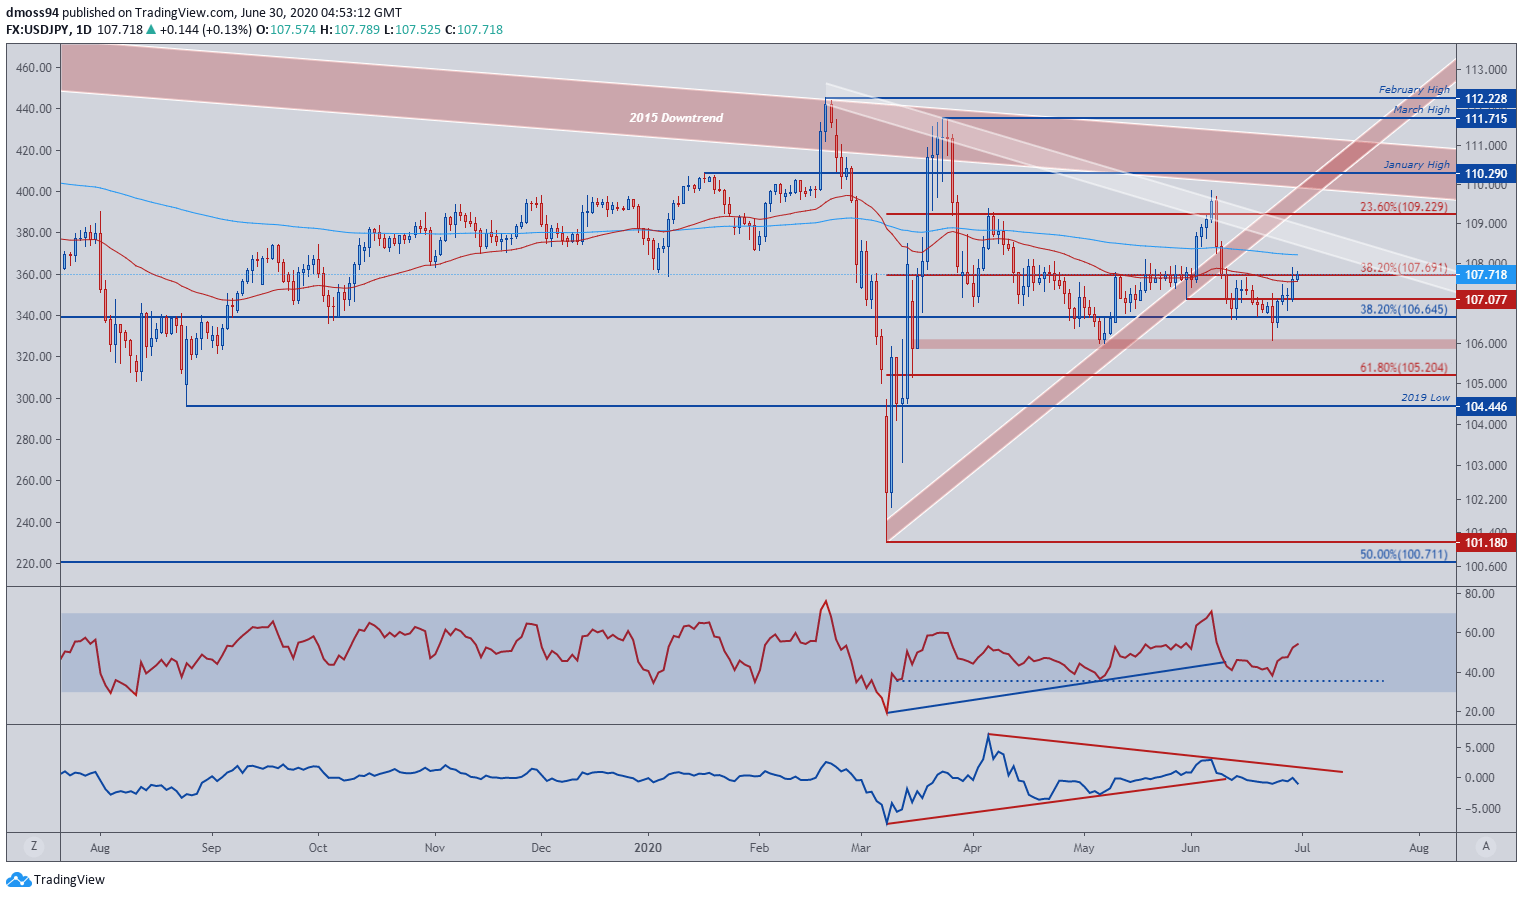
USD/JPY Daily Chart – Rate Eyeing 200-Day Moving Average
Source - TradingView
USD/JPY continues to recoup lost ground after collapsing 3% from the June high (109.85) before reacting to the psychologically imposing 106-handle.
Initial development in the RSI late last week suggested price would continue to breakdown, but the steep reversal prior to oversold readings could see USD/JPY work its way back to the 200-day moving average (108.21).
Having said that, the momentum indicator has diverged from price and its fellow technical oscillator, hinting at an underlying degree of bearishness in USD/JPY, which could see the exchange rate reverse at the February downtrend as its done on two previous occasions.
Reaction around the 200-MA (108.21) could provide a key tell for future direction, with the inability to clear the sentiment-driving moving average possibly signalling a reversal of the 5-day rally.
| Change in | Longs | Shorts | OI |
| Daily | 3% | 0% | 1% |
| Weekly | -6% | 3% | 2% |
-- Written by Daniel Moss
Follow me on Twitter @DanielGMoss


