
Consider, for a moment, some of the most pernicious challenges facing humanity today: the increasing prevalence of natural disasters; the systemic overfishing of the world’s oceans; the clear-cutting of primeval forests; the maddening persistence of poverty; and above all, the accelerating effects of global climate change.
Each item in this dark litany inflicts suffering on the world in its own, awful way. Yet as a group, they share some common characteristics. Each problem is messy, with lots of moving parts. Each is riddled with perverse incentives, which can lead local actors to behave in a way that is not in the common interest. Each is opaque, with dynamics that are only partially understood, even by experts; each can, as a result, often be made worse by seemingly rational and well-intentioned interventions. When things do go wrong, each has consequences that diverge dramatically from our day-to-day experiences, making their full effects hard to imagine, predict, and rehearse. And each is global in scale, raising questions about who has the legal obligation to act—and creating incentives for leaders to disavow responsibility (and sometimes even question the legitimacy of the problem itself).
With dynamics like these, it’s little wonder systems theorists label these kinds of problems “wicked” or even “super wicked.” It’s even less surprising that these challenges remain, by and large, externalities to the global system—inadequately measured, perennially underinvested in, and poorly accounted for—until their consequences spill disastrously and expensively into view.
For real progress to occur, we’ve got to move these externalities into the global system, so that we can fully assess their costs, and so that we can sufficiently incentivize and reward stakeholders for addressing them and penalize them if they don’t. And that’s going to require a revolution in measurement, reporting, and financial instrumentation—the mechanisms by which we connect global problems with the resources required to address them at scale.
Are you enjoying this article? Read more like this, plus SSIR's full archive of content, when you subscribe.
Thankfully, just such a revolution is under way.
It’s a complex story with several moving parts, but it begins with important new technical developments in three critical areas of technology: remote sensing and big data, artificial intelligence, and cloud computing.
Remote sensing and big data allow us to collect unprecedented streams of observations about our planet and our impacts upon it, and dramatic advances in AI enable us to extract the deeper meaning and patterns contained in those vast data streams. The rise of the cloud empowers anyone with an Internet connection to access and interact with these insights, at a fraction of the traditional cost.
In the years to come, these technologies will shift much of the current conversation focused on big data to one focused on “big indicators”—highly detailed, continuously produced, global indicators that track change in the health of the Earth’s most important systems, in real time. Big indicators will form an important mechanism for guiding human action, allow us to track the impact of our collective actions and interventions as never before, enable better and more timely decisions, transform reporting, and empower new kinds of policy and financing instruments. In short, they will reshape how we tackle a number of global problems, and everyone—especially nonprofits, NGOs, and actors within the social and environmental sectors—will play a role in shaping and using them.
The Four I’s
Here’s a simple mental model called the Four I’s that shows how these pieces fit together.
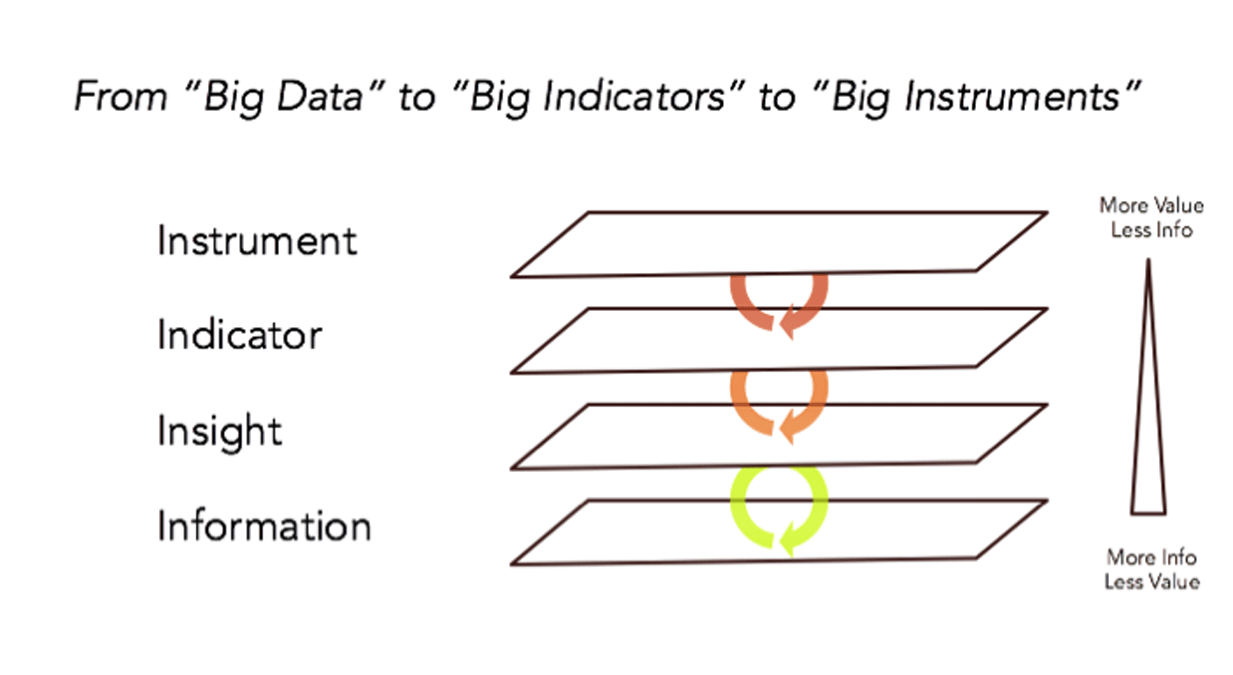
At the heart of the model is the foundational, information layer. This is where a number of current technology trends converge: the big data revolution, the open data movement, the rise of mobile and social media, and the proliferation of sensors in your pocket, in the environment, in the ocean, in the sky, and in space. Together, these trends are dramatically accelerating the volume of accessible, real-time information about the world we live in. By one estimate, humanity is now producing about two-and-a-half-million terabytes of data every day. The volume is growing so quickly that 90 percent of all accessible data on Earth was produced in the last two years alone. Soon, one supposes, that number will seem quaint.
By illuminating information previously in darkness, these sensing technologies are revolutionizing what we know about global systems, and enabling us to intervene in more targeted and effective ways.
Nowhere is this opportunity clearer than in the example of protecting vulnerable forests, many of which are large, remote, and located in low- and middle-income countries with limited financial and human resources. The Amazon rainforest, for example, is roughly nine times the size of Texas; it’s far too big to regularly patrol anything more than a fraction of it from the ground or even by air. Meanwhile, the economic pressures to deforest, or to convert land for agriculture, mining, or other purposes, remain intense.
With strong incentives to exploit the forest and limited monitoring capabilities, timber clearing has been difficult to stop and can go undetected until long after it occurs. In Brazil, for instance, between August 2016 and August 2017, the government estimates more than 66 thousand square kilometers of Amazonian rainforest were illegally deforested—an area equal in size to 112 Manhattans or half the US state of Maryland—in just 12 months. And that was in a relatively “good” year.
Fortunately, the situation is now changing. Better, more real-time information—in this case, delivered by satellites, drones, and other sensors—can continuously monitor the state of the forests, and enable more responsive and forward-looking management.
My own organization, Planet, has deployed the world’s largest constellation of Earth-observing satellites, capable of monitoring every forest, every tree, and every city block, everywhere on Earth on a daily basis. This persistent, real-time system enables forest managers, for example, to not only see the signs of deforestation as they are occurring (as opposed to long after), but also detect the precursors of deforestation— signals such as the establishment of illegal roads that tend to appear before trees are illegally harvested.
Planet is only one of a number of organizations revolutionizing remote sensing. Another, SailDrone, is deploying vast fleets of autonomous sailing vehicles, and countless other drone and embedded sensors, to monitor the oceans. And that’s to say nothing of the troves of social and mobile data that billions of us create every day. Facebook, for instance, recently demonstrated how its platform can identify the locations and movements of people affected by major natural disasters, helping NGOs target aid where it’s needed most. These examples are just part of an emerging network of global sensing systems that have the potential to make daily change on the planet visible, accessible, and actionable for all.
However, while such datasets have tremendous value, the most important signals hidden within them are often subtle and can be hard to spot without significant additional analysis. The sheer volume of available information can make big data logistically challenging to work with, and many stakeholders— whether companies, community members, NGOs, or governments—lack the technical capacity and resources to make full use of it.
Fortunately, there is a concurrent insights revolution underway, and this forms the second layer in our model. Here, breakthroughs in artificial intelligence, computer vision, crowdsourcing, and related analytical approaches are converging in ways that allow us to detect patterns in data that would elude even the most sophisticated human analysis.
Typically, these approaches employ multiple data sets and some expert assessment to “train” algorithms to do advanced pattern recognition. For example, let’s say we wanted to automatically classify features in satellite imagery, such as the appearance of new roads, new construction, or the effects of a natural disaster. To do this, we might use sample data from several sources, such as carefully labeled terrestrial observations collected via mobile devices, crowdsourced analysis of imagery made by online volunteers, and open-source government maps of existing infrastructure.
A machine-learning algorithm—a specialized computational model based on the way the brain works—typically ingests these very different datasets. Once properly “trained” to find categorical correlations among the various datasets, this algorithm can then find and classify features in new, never-before-seen imagery, often with a high degree of accuracy.
Variations of this technique have already shown early promise in classifying damage from earthquakes, predicting smallholder agricultural yields, identifying flood risks, estimating poverty, and even finding evidence of war crimes. Importantly, these analytical methods reduce the total volume of data we have to contend with while increasing its value by identifying and isolating what matters most.
These two revolutions—information and insights—are where most technical innovation is occurring today. But in the next few years, we’re going to see new kinds of value built on top of these revolutions that will change the way we go about addressing important social and ecological challenges at scale.
From Big Data to Big Indicators
As noted above, one of the reasons global challenges like climate change remain intractable is because they’re opaque. They lack reliable, real-time indicators that can shape near- and long-term decision-making, guide collective action, and tell us if and how we’re making progress.
However, with increasingly robust streams of real-time information and ever-more sophisticated insights, this situation is set to change. We’re about to begin an era of big indicators that tell us about the health of many the world’s least-well-understood and poorly monitored systems.
Imagine a daily, accurate, and continuously updated tally of the amount of carbon lost through deforestation; or a precise measure of the net loss of biodiversity; or real-time, spatially explicit assessment of the number of people entering (or exiting) poverty; or an actionable estimate of the total value of coastal infrastructure at risk from extreme weather events. These are big indicators.
Much like the difference between data and big data, the difference between an indicator and a big indicator is somewhat subjective, but here are a few ways big indicators vary from their more traditional cousins:
- Precision and resolution: Because they are based on vastly more real-time information than a typical indicator, a big indicator will tell us what is happening in a system with much greater spatial and temporal resolution, precision, and sensitivity. It might tell us about the growth of a city, a particular neighborhood, and a given block with equal precision.
- Frequency: Since they are continuously recalculated, big indicators will tell us how a system is doing day to day, not just year over year. As such, they can help us answer questions like: Is a particular intervention working? Making things better or worse? Having intended or unintended consequences?
- Scale and Reach: Because big indicators take advantage of the global reach of new sensors and datasets, they can capture the state of systems previously too large, too remote, or too expensive to monitor effectively.
- Predictive Capacity: As we collect more and more data about the world, in many areas we are beginning to find not only the markers of past change, but also the early warning signs of impending change. Big indicators will not only tell us where the system is at a given moment, but also where it is likely to go in the future.
- Sophistication: As noted, many of the world’s critical systems behave in complex and counter-intuitive ways. They also influence each other in subtle and unobvious ways. Big indicators will begin to illuminate these behaviors and connections so that we can create more effective, comprehensive, and long-lasting interventions.
- Interoperability: Big indicators will allow us to compare patterns and processes across jurisdictions. They will, in effect, become new measurement and reporting standards.
Developing big indicators will be a complex undertaking—both technically and organizationally. First, the underlying data and insights that power them must be accurate, transparent, reliable, and widely accessible, as well as independently auditable and verifiable—in a word, open. That’s because trust is essential—without it, there’s little hope of adoption.
Designing these kinds of indicators will require significant collaboration between data providers, subject-matter experts, computer scientists, international bodies like the UN, local governments, civil society actors, independent scientific bodies, and advocacy organizations, much of which is just starting. There are also significant data, capacity, and governance gaps to address. Many of the places in the world where we most need big indicators are also the places least prepared to produce and act on them.
But as we collaborate to fill these gaps, the dynamics of the world system will become much more transparent. And transparency begets accountability and action.
The mechanism of much of that accountability and action will be a whole new class of market-like “big instruments”—new technological, governance, and (especially) financial instruments that can align resources and incentives, and encourage effective action at scale. This is the fourth and final layer of our model.
There is certainly sufficient capital available. Today, long-term asset holders—entities like pension funds, sovereign wealth funds, university and philanthropic endowments, and family offices—control more than $25 trillion in capital. These entities are large and long lasting, as such they are exposed over the long-term to the very kinds of volatility that big indicators could help measure, and they are sufficiently mission-aligned to have a stake in reducing their volatility and disruptive power.
Unfortunately, not enough of this capital is currently invested in efforts to reduce the effects of climate change, promote the health of our ecosystems, or ensure social stability and wellbeing, largely because there are few robust, market-oriented avenues for doing so. Big indicators will fill in a significant missing piece of the puzzle by enabling (from a data and reporting perspective) the next generation of green and blue bonds, pay-for-performance models like REDD+ (which works to reduce emissions from deforestation in developing countries), social impact investments, disaster risk bonds, and other financial instruments, as well as related, market-like programs.
You can see a very early example of this in the emerging work of Blue Forest Conservation, a San Francisco Bay Area firm pioneering Forest Resilience Bonds—specialized financial instruments that allow private investors to fund forest restoration in the Western United States. California’s forests have become both severely overgrown and, thanks to climate change, increasingly dry—leading to catastrophic fires that cause devastating loss of life and property, and consume more than half of the US Forest Service’s annual budget. These bonds allow private investors to fund forest thinning, a process that reduces tinder and thus the risk and severity of fires, and share in the resulting federal savings over time.
The fully-scaled descendants of financial instruments like these are the tools by which we will connect the vast resources of the capital markets to real world problems, such as ecosystems experiencing climate stress. And big indicators will power them. This, in turn, will allow us to reintegrate what have previously been “externalities” (the unpriced and unaccounted-for ecological and social costs of human civilization) into our global economy, and help us return to a safer operating space for humanity and the planet.
Support SSIR’s coverage of cross-sector solutions to global challenges.
Help us further the reach of innovative ideas. Donate today.
Read more stories by Andrew Zolli.