Are International Business Machines Corporation’s (NYSE:IBM) Interest Costs Too High?

Investors pursuing a solid, dependable stock investment can often be led to International Business Machines Corporation (NYSE:IBM), a large-cap worth US$132.32B. Market participants who are conscious of risk tend to search for large firms, attracted by the prospect of varied revenue sources and strong returns on capital. However, the key to their continued success lies in its financial health. Today we will look at International Business Machines’s financial liquidity and debt levels, which are strong indicators for whether the company can weather economic downturns or fund strategic acquisitions for future growth. Note that this commentary is very high-level and solely focused on financial health, so I suggest you dig deeper yourself into IBM here. See our latest analysis for International Business Machines
Does IBM produce enough cash relative to debt?
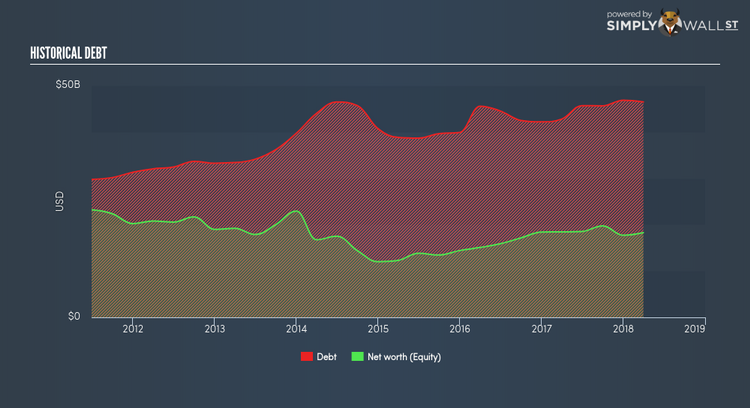
IBM’s debt levels surged from US$42.18B to US$46.86B over the last 12 months – this includes both the current and long-term debt. With this rise in debt, IBM currently has US$12.58B remaining in cash and short-term investments for investing into the business. On top of this, IBM has generated cash from operations of US$16.72B over the same time period, leading to an operating cash to total debt ratio of 35.69%, indicating that IBM’s current level of operating cash is high enough to cover debt. This ratio can also be a sign of operational efficiency as an alternative to return on assets. In IBM’s case, it is able to generate 0.36x cash from its debt capital.
Can IBM meet its short-term obligations with the cash in hand?
Looking at IBM’s most recent US$37.36B liabilities, the company has been able to meet these obligations given the level of current assets of US$49.74B, with a current ratio of 1.33x. Usually, for IT companies, this is a suitable ratio since there’s sufficient cash cushion without leaving too much capital idle or in low-earning investments.
Is IBM’s debt level acceptable?
Since equity is smaller than total debt levels, International Business Machines is considered to have high leverage. This isn’t surprising for large-caps, as equity can often be more expensive to issue than debt, plus interest payments are tax deductible. Accordingly, large companies often have lower cost of capital due to easily obtained financing, providing an advantage over smaller companies. We can check to see whether IBM is able to meet its debt obligations by looking at the net interest coverage ratio. Ideally, earnings before interest and tax (EBIT) should cover net interest by at least three times. For IBM, the ratio of 26.3x suggests that interest is comfortably covered. Large-cap investments like IBM are often believed to be a safe investment due to their ability to pump out ample earnings multiple times its interest payments.
Next Steps:
IBM’s high cash coverage means that, although its debt levels are high, the company is able to utilise its borrowings efficiently in order to generate cash flow. Since there is also no concerns around IBM’s liquidity needs, this may be its optimal capital structure for the time being. This is only a rough assessment of financial health, and I’m sure IBM has company-specific issues impacting its capital structure decisions. I suggest you continue to research International Business Machines to get a better picture of the large-cap by looking at:
Future Outlook: What are well-informed industry analysts predicting for IBM’s future growth? Take a look at our free research report of analyst consensus for IBM’s outlook.
Valuation: What is IBM worth today? Is the stock undervalued, even when its growth outlook is factored into its intrinsic value? The intrinsic value infographic in our free research report helps visualize whether IBM is currently mispriced by the market.
Other High-Performing Stocks: Are there other stocks that provide better prospects with proven track records? Explore our free list of these great stocks here.
To help readers see pass the short term volatility of the financial market, we aim to bring you a long-term focused research analysis purely driven by fundamental data. Note that our analysis does not factor in the latest price sensitive company announcements.
The author is an independent contributor and at the time of publication had no position in the stocks mentioned.
