Should You Be Impressed By Unilever PLC's (LON:ULVR) ROE?

Want to participate in a short research study? Help shape the future of investing tools and you could win a $250 gift card!
One of the best investments we can make is in our own knowledge and skill set. With that in mind, this article will work through how we can use Return On Equity (ROE) to better understand a business. To keep the lesson grounded in practicality, we'll use ROE to better understand Unilever PLC (LON:ULVR).
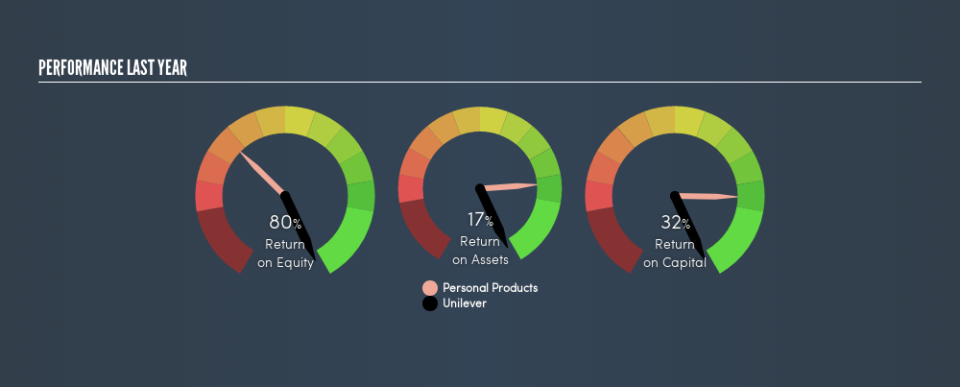
Our data shows Unilever has a return on equity of 80% for the last year. One way to conceptualize this, is that for each £1 of shareholders' equity it has, the company made £0.80 in profit.
See our latest analysis for Unilever
How Do I Calculate ROE?
The formula for ROE is:
Return on Equity = Net Profit ÷ Shareholders' Equity
Or for Unilever:
80% = €9.4b ÷ €12b (Based on the trailing twelve months to December 2018.)
Most know that net profit is the total earnings after all expenses, but the concept of shareholders' equity is a little more complicated. It is all the money paid into the company from shareholders, plus any earnings retained. You can calculate shareholders' equity by subtracting the company's total liabilities from its total assets.
What Does Return On Equity Mean?
ROE measures a company's profitability against the profit it retains, and any outside investments. The 'return' is the profit over the last twelve months. The higher the ROE, the more profit the company is making. So, all else equal, investors should like a high ROE. Clearly, then, one can use ROE to compare different companies.
Does Unilever Have A Good Return On Equity?
Arguably the easiest way to assess company's ROE is to compare it with the average in its industry. Importantly, this is far from a perfect measure, because companies differ significantly within the same industry classification. As you can see in the graphic below, Unilever has a higher ROE than the average (8.7%) in the Personal Products industry.
That's clearly a positive. I usually take a closer look when a company has a better ROE than industry peers. One data point to check is if insiders have bought shares recently.
Why You Should Consider Debt When Looking At ROE
Companies usually need to invest money to grow their profits. That cash can come from issuing shares, retained earnings, or debt. In the case of the first and second options, the ROE will reflect this use of cash, for growth. In the latter case, the debt used for growth will improve returns, but won't affect the total equity. Thus the use of debt can improve ROE, albeit along with extra risk in the case of stormy weather, metaphorically speaking.
Combining Unilever's Debt And Its 80% Return On Equity
Unilever does use a significant amount of debt to increase returns. It has a debt to equity ratio of 2.02. There's no doubt its ROE is impressive, but the company appears to use its debt to boost that metric. Debt increases risk and reduces options for the company in the future, so you generally want to see some good returns from using it.
In Summary
Return on equity is a useful indicator of the ability of a business to generate profits and return them to shareholders. Companies that can achieve high returns on equity without too much debt are generally of good quality. If two companies have the same ROE, then I would generally prefer the one with less debt.
But ROE is just one piece of a bigger puzzle, since high quality businesses often trade on high multiples of earnings. The rate at which profits are likely to grow, relative to the expectations of profit growth reflected in the current price, must be considered, too. So you might want to check this FREE visualization of analyst forecasts for the company.
If you would prefer check out another company -- one with potentially superior financials -- then do not miss this free list of interesting companies, that have HIGH return on equity and low debt.
We aim to bring you long-term focused research analysis driven by fundamental data. Note that our analysis may not factor in the latest price-sensitive company announcements or qualitative material.
If you spot an error that warrants correction, please contact the editor at editorial-team@simplywallst.com. This article by Simply Wall St is general in nature. It does not constitute a recommendation to buy or sell any stock, and does not take account of your objectives, or your financial situation. Simply Wall St has no position in the stocks mentioned. Thank you for reading.
