- USD/JPY bears are taking control and eye a run to 125 the figure for the days ahead.
- The four-hour outlook is bullish for the immediate hours as the price corrects towards a 38.2% Fibo.
As per the prior series of analyses, USD/JPY embarks on a significant correction below key daily support, and before that, USD/JPY Price Analysis: Bulls meeting tough resistance from bears despite bull flag, the price is moving in accordance with the bearish outlook and the following illustrates the before, now and possibilities for the forthcoming sessions and days ahead.
USD/JPY prior analysis
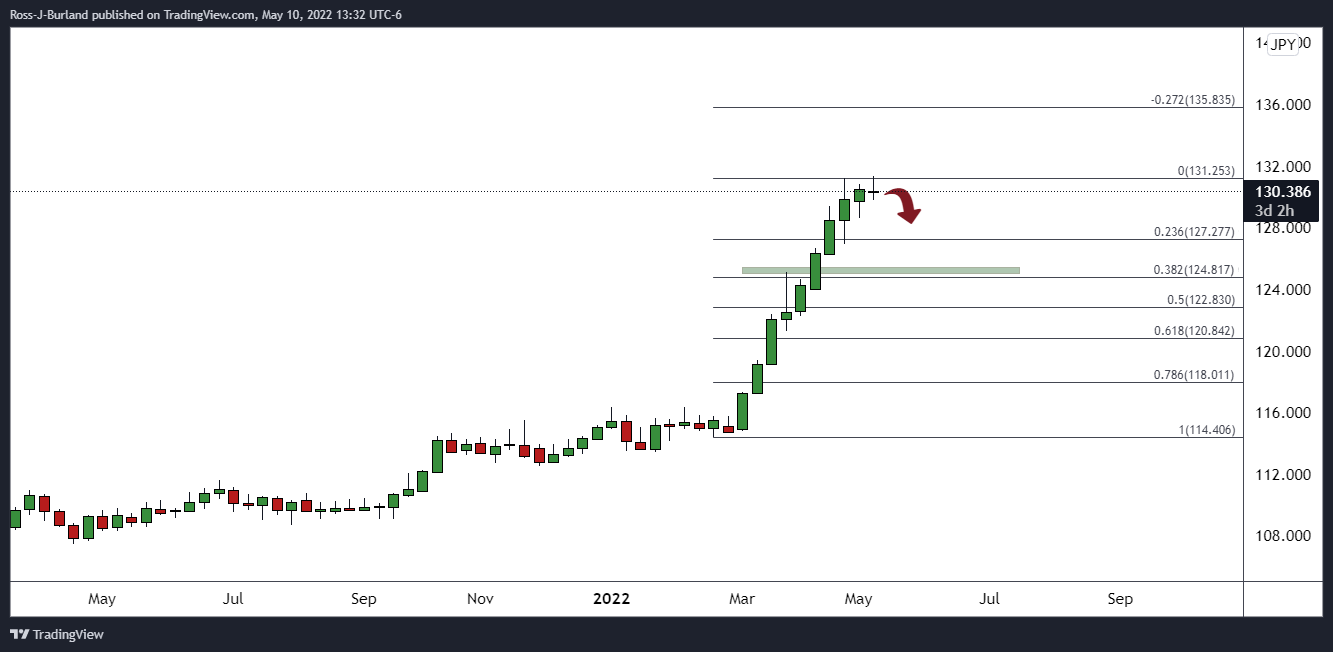
From a weekly perspective, the price was potentially overstretched and due for a correction. On the daily chart, the price had formed a W-formation which pulled in the bids and offers started to emerge:
The bull flag breakout failed:
The pair had bucked the trend last Thursday, breaking below prior support and denied the bulls that were otherwise seeking more from the bullish flag pattern on the daily chart:
The price action had left an M-formation on the daily chart, the opposite of the prior W-formation. These patterns often see the price reverting to restest the prior lows or the neckline of the chart pattern. In this case, the neckline was near 129.80.
USD/JPY live market
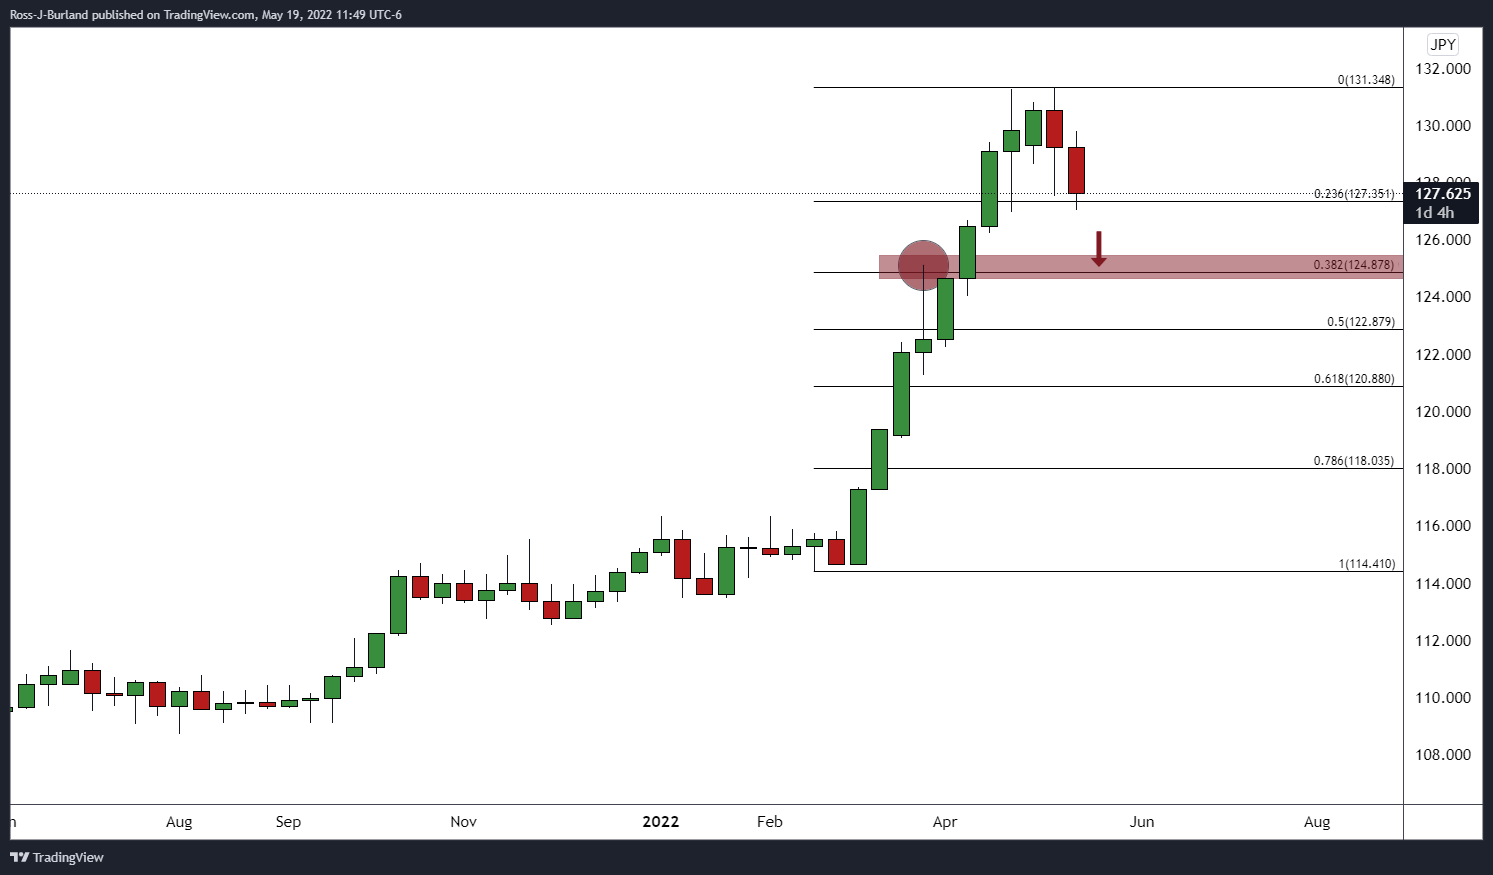
The weekly correction is well and truly underway with eyes on a break of 127 the figure and then the 38.2% Fibonacci retracement that aligns with prior highs made in Feb near 125.00.
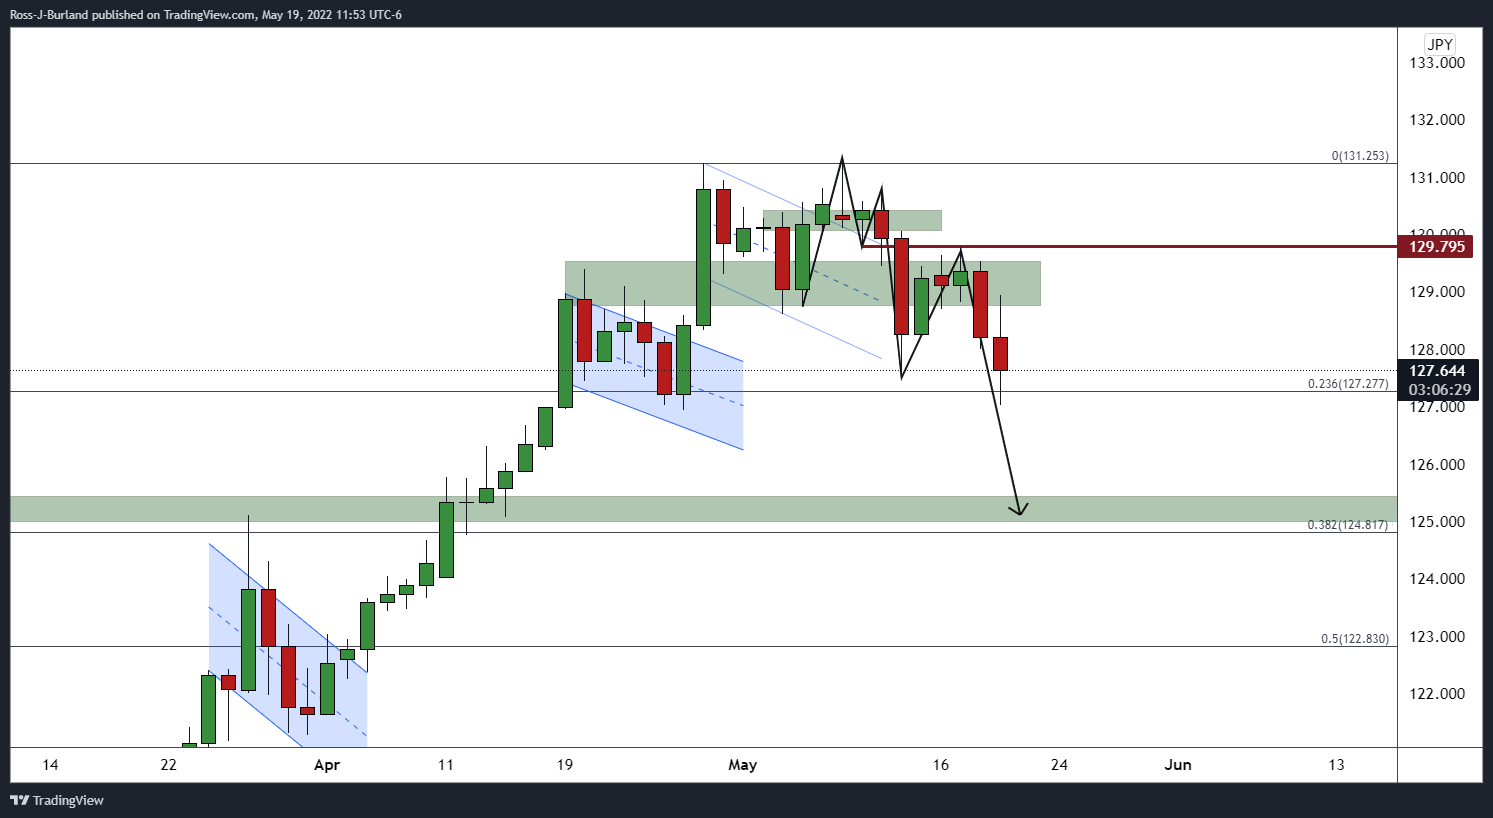
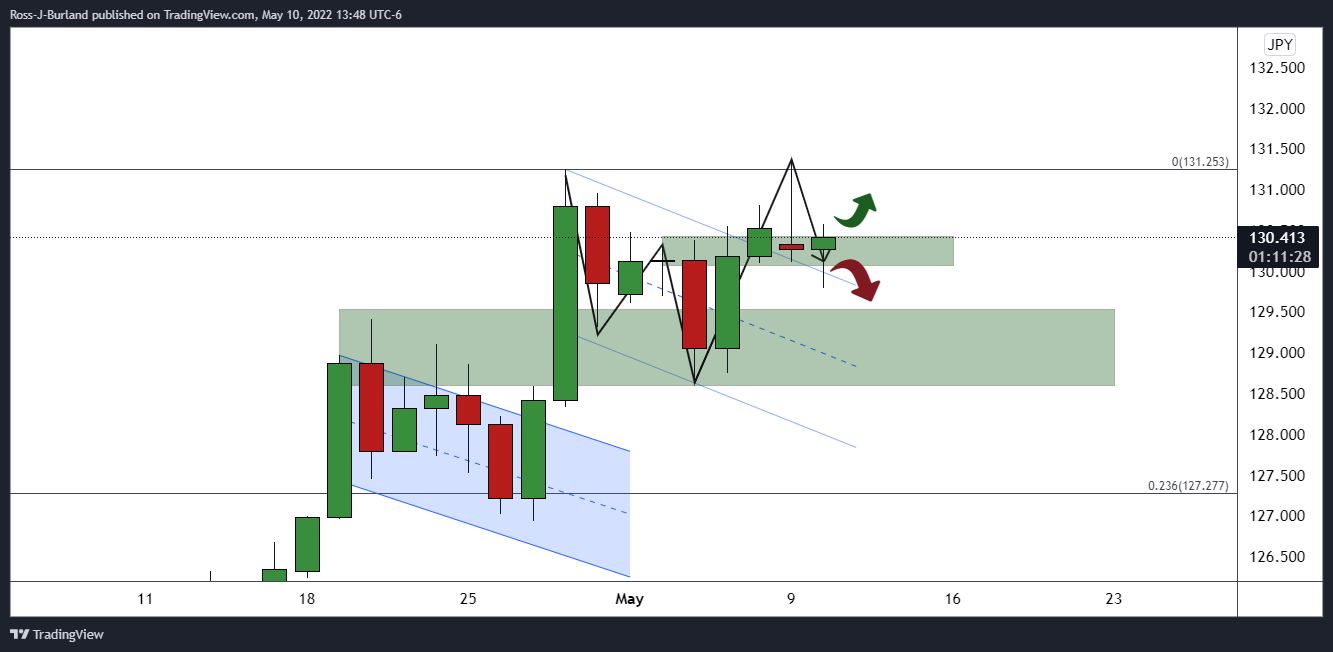
The daily chart has seen the price revert to test the neckline of the M-formation at 129.795 and has since moved lower in a downside continuation.
However, another M-formation has been left:
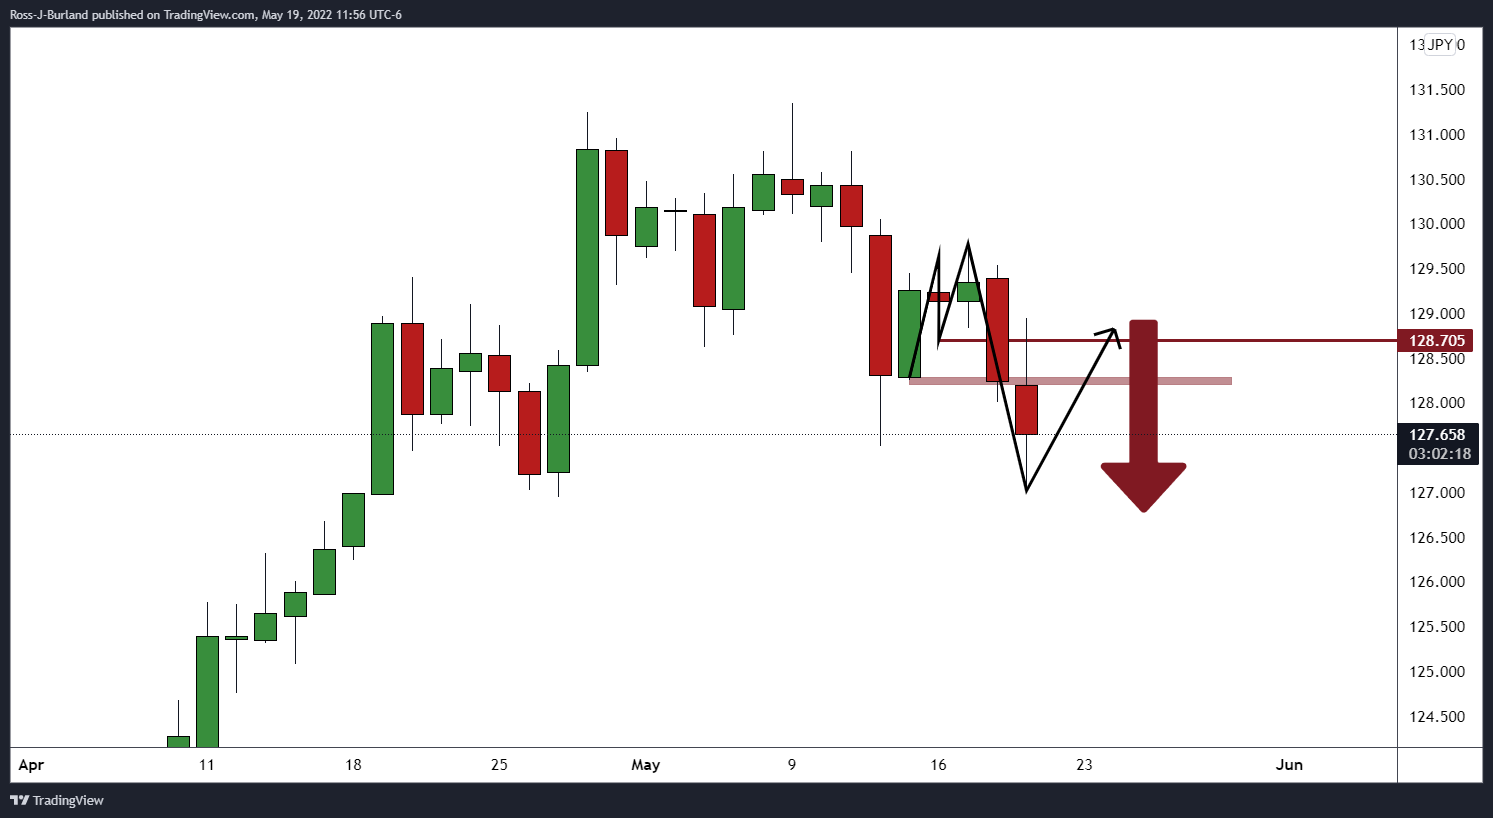
Whether the bears commit now on a daily basis having already forced back the bears from the neckline at 128.705, or if the price needs to close on a daily basis into the neckline, the outlook is still bearish.
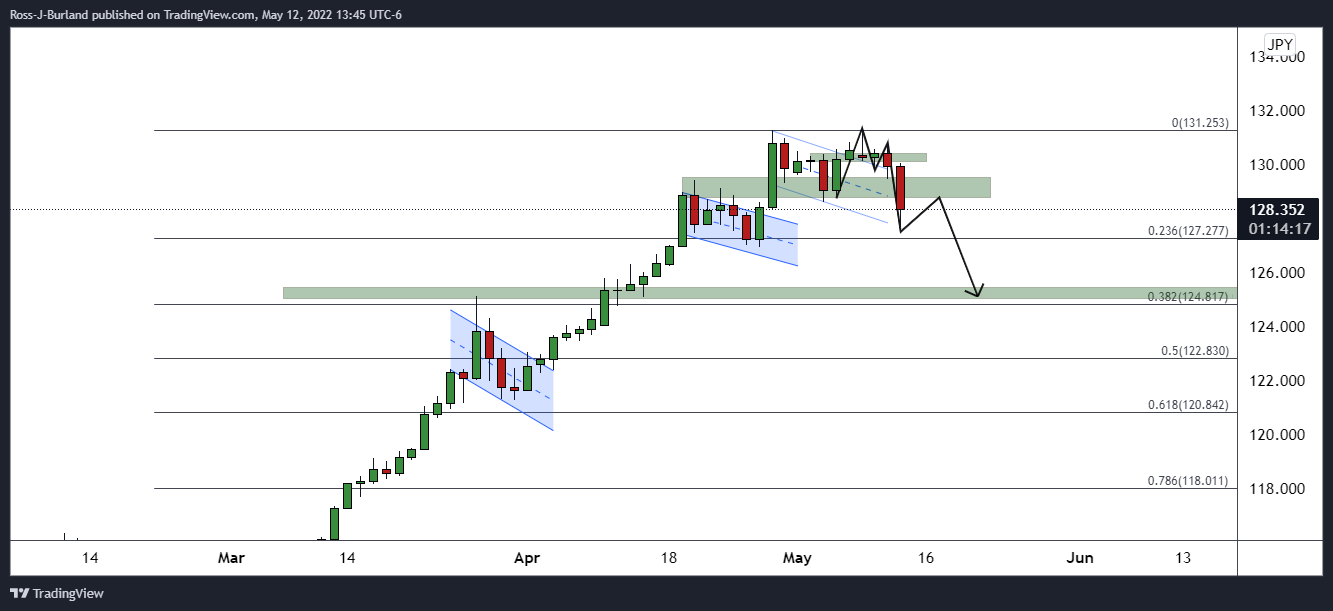
USD/JPY H4 chart
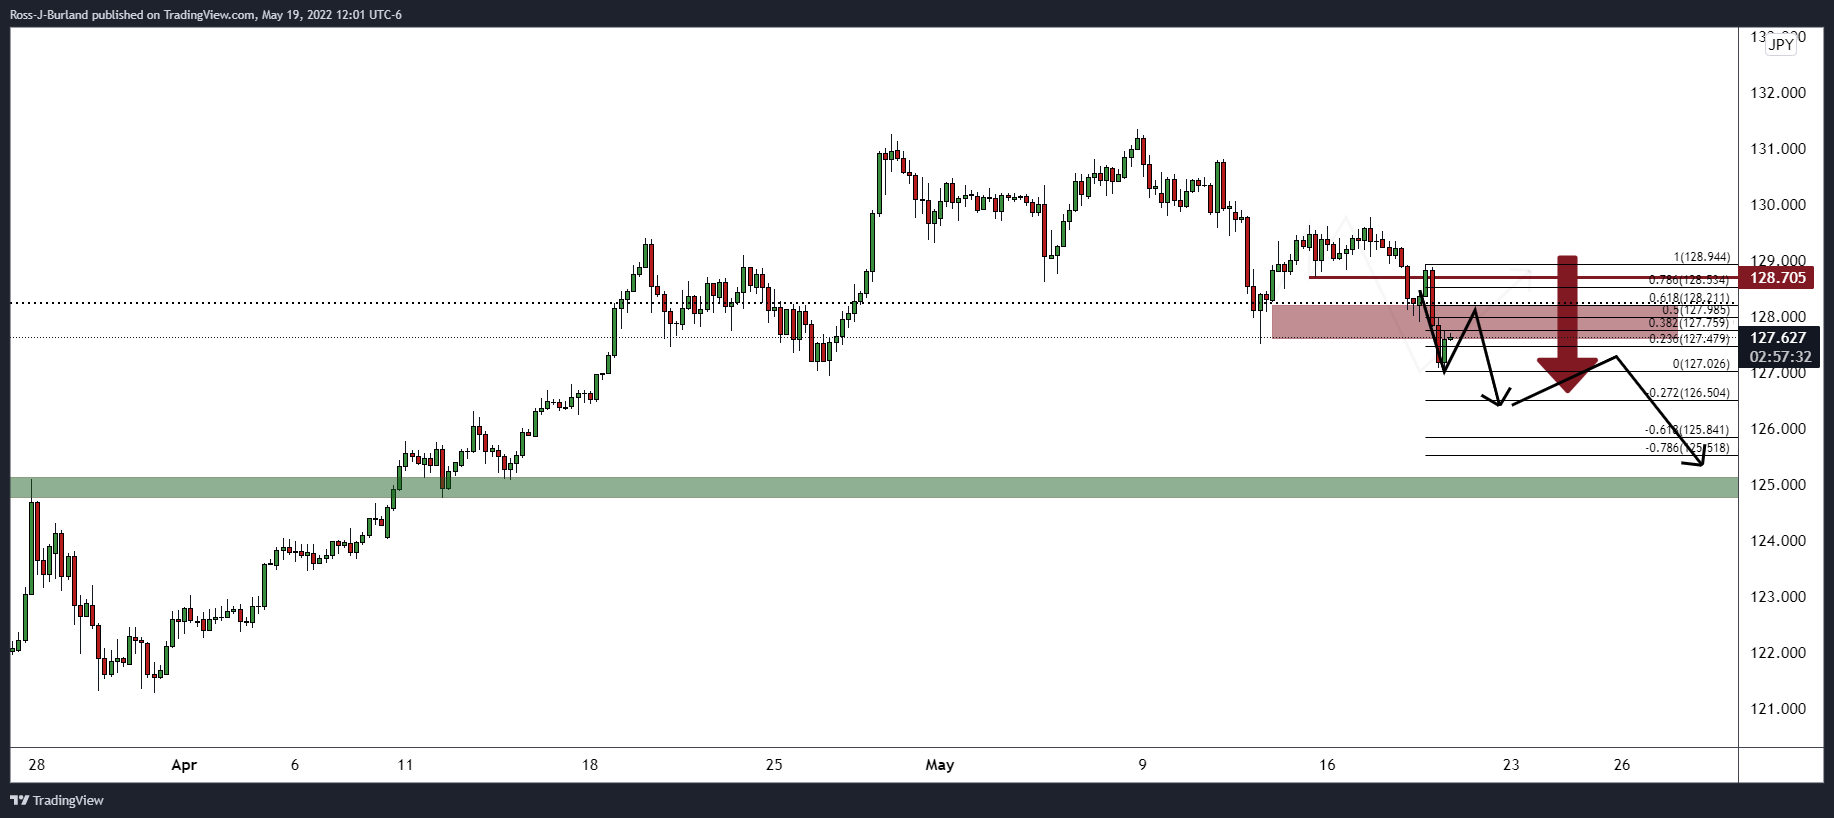
The four-hour outlook is bullish for the immediate hours as the price corrects towards a 38.2% Fibo and to test the resistance structure. If the bears commit between here and the 61.8% ratio near 128.20, then there will be scope for a downside continuation and fresh corrective low for the days ahead. A break of 126.50 will be required in order to clear the way toward the weekly 38.2% ratio target nearer 125 the figure. On the flipside, 128.705 is a key resistance that could be the ultimate defence of a bullish continuation.
Information on these pages contains forward-looking statements that involve risks and uncertainties. Markets and instruments profiled on this page are for informational purposes only and should not in any way come across as a recommendation to buy or sell in these assets. You should do your own thorough research before making any investment decisions. FXStreet does not in any way guarantee that this information is free from mistakes, errors, or material misstatements. It also does not guarantee that this information is of a timely nature. Investing in Open Markets involves a great deal of risk, including the loss of all or a portion of your investment, as well as emotional distress. All risks, losses and costs associated with investing, including total loss of principal, are your responsibility. The views and opinions expressed in this article are those of the authors and do not necessarily reflect the official policy or position of FXStreet nor its advertisers. The author will not be held responsible for information that is found at the end of links posted on this page.
If not otherwise explicitly mentioned in the body of the article, at the time of writing, the author has no position in any stock mentioned in this article and no business relationship with any company mentioned. The author has not received compensation for writing this article, other than from FXStreet.
FXStreet and the author do not provide personalized recommendations. The author makes no representations as to the accuracy, completeness, or suitability of this information. FXStreet and the author will not be liable for any errors, omissions or any losses, injuries or damages arising from this information and its display or use. Errors and omissions excepted.
The author and FXStreet are not registered investment advisors and nothing in this article is intended to be investment advice.
Recommended content
Editors’ Picks
AUD/USD remains under pressure above 0.6400

AUD/USD managed to regain some composure and rebounded markedly from Tuesday’s YTD lows in the sub-0.6400 region ahead of the release of the Australian labour market report on Thursday.
EUR/USD faces decent contention around 1.0600

The knee-jerk in the Greenback reignited some buying interest in the risk complex and pushed EUR/USD to three-day highs near 1.0680, rapidly leaving behind the recent yearly low around 1.0600.
Gold eases despite risk-off mood

Gold trades in a relatively tight range near $2,390 in the second half of the day on Wednesday. In the absence of high-tier data releases, investors keep a close eye on headlines surrounding the Iran-Israel conflict.
Ethereum trades around the $3,000 support following a surge in validator queue

Ethereum (ETH) continued a sideways movement on Wednesday as investors seemed to be waiting for an upward or downward price catalyst. Despite the price stagnancy, the ETH validator queue - possibly fueled by the DeFi restaking boom - rose sharply.
Markets stabilize after Powell rules out rate hike, but the signs don’t look good

Markets are volatile right now; however, a relative calm has descended on the market and US. US stocks are down a touch, but the Vix is lower, US Treasury yields are lower, and the dollar is mostly lower vs. its G10 FX counterparts.