


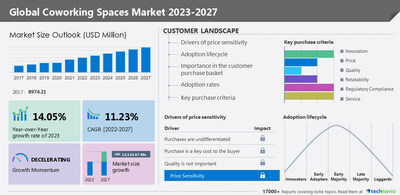
NEW YORK, Jan. 24, 2023 /PRNewswire/ -- According to Technavio, the global coworking spaces market size is estimated to grow by USD 14,124.67 million from 2022 to 2027. However, the growth momentum will decelerate at a CAGR of 11.23%. APAC will account for 37% of the growth of the global market during the forecast period.

For more insights on market size, request a sample report
Global coworking spaces market - Five forces
The global coworking spaces market is fragmented, and the five forces analysis covers–
- Bargaining power of buyers
- The threat of new entrants
- Threat of rivalry
- Bargaining power of suppliers
- Threat of substitutes
- For interpretation of Porter's five forces model – buy the report!
Global coworking spaces market – Customer landscape
The report includes the market's adoption lifecycle, from the innovator's stage to the laggard's stage. It focuses on adoption rates in different regions based on penetration. Furthermore, the report also includes key purchase criteria and drivers of price sensitivity to help companies evaluate and develop their growth strategies.
Global coworking spaces market - Segmentation assessment
Segment overview
Technavio has segmented the market based on end-user (enterprises and SMEs and freelancers and start-ups) and type (conventional coworking spaces, professional coworking spaces, and others).
- The enterprises and SMEs segment will grow at a significant rate during the forecast period. A coworking space is an effective workplace strategy employed by numerous enterprises and SMEs. Small-scale businesses prefer flexible workspace environments to support their expansion and accommodate their diverse workforce. Therefore, coworking spaces are gaining traction among global enterprises and SMEs. Such factors will drive the growth of this segment during the forecast period.
Geography overview
Based on geography, the global coworking spaces market is segmented into APAC, Europe, North America, South America, and Middle East and Africa. The report provides actionable insights and estimates the contribution of all regions to the growth of the global coworking spaces market.
- APAC is estimated to account for 37% of the growth of the global market during the forecast period. The demand for coworking spaces in the region is supported by the emergence of start-up ecosystems, the rising demand for flexible workspaces, and advances in technologies. Coworking spaces are cost-effective alternatives to traditional offices. Hong Kong, Sydney, Singapore, Melbourne, Tokyo, and Shanghai have the highest concentration of coworking spaces in the region. Thus, the increase in the number of start-ups and SMEs will drive the demand for coworking spaces in APAC during the forecast period.
Global coworking spaces market – Market dynamics
Key factor driving market growth
- The advantages of coworking spaces are driving market growth.
- Coworking spaces can hold multiple business operations, which enables several entrepreneurs to work under a single roof.
- These spaces offer a dynamic environment that helps start-ups, SMEs, and individual entrepreneurs grow.
- They also help lower the real estate cost of a company and provide flexibility in procuring and managing spaces.
- The collaborative learning environments offered by coworking spaces enable people from diverse backgrounds to work together.
- Therefore, the benefits of coworking spaces can propel the growth of the market during the forecast period.
Leading trends influencing the market
- The growing inclination of coworking spaces toward technology-driven management is a key trend in the market.
- Coworking space operators are investing in technology-driven management solutions, such as coworking space management software, visitor management systems, appointment scheduling software, and resource management systems.
- They are employing advanced technologies such as IoT-enabled key cards, Wiegand cards, proximity cards, and magnetic stripe cards.
- These factors will propel the growth of the market during the forecast period.
Major challenges hindering market growth
- Limited space and equipment are challenging the growth of the market.
- The lack of privacy in coworking spaces can lead to employee dissatisfaction and unproductivity.
- Insufficient equipment is another major challenge faced by companies, as workers find it difficult to reach their daily targets.
- Such challenges can impede the growth of the market during the forecast period.
What are the key data covered in this coworking spaces market report?
- CAGR of the market during the forecast period
- Detailed information on factors that will drive the growth of the coworking spaces market between 2023 and 2027
- Precise estimation of the size of the coworking spaces market and its contribution to the parent market
- Accurate predictions about upcoming trends and changes in consumer behavior
- Growth of the coworking spaces market across APAC, Europe, North America, South America, and Middle East and Africa
- A thorough analysis of the market's competitive landscape and detailed information about vendors
- Comprehensive analysis of factors that will challenge the growth of coworking spaces market vendors
Gain instant access to 17,000+ market research reports.
Technavio's SUBSCRIPTION platform
Related Reports:
The MEP services market is estimated to grow at a CAGR of 11.5% between 2022 and 2027. The size of the market is forecasted to increase by USD 80.54 billion. This report extensively covers market segmentation by service (consulting and engineering, maintenance and support, and system integration), end-user (commercial, government, and residential), and geography (North America, APAC, Europe, South America, and Middle East and Africa).
The MRO market for automation solutions market is estimated to grow at a CAGR of 10.16% between 2022 and 2027. The size of the market is forecasted to increase by USD 54,089.21 million. This report extensively covers market segmentation by end-user (process industries and discrete industries), type (MRO items and services), and geography (APAC, Europe, North America, South America, and the Middle East and Africa).
Coworking Spaces Market Scope | |
Report Coverage | Details |
Page number | 157 |
Base year | 2022 |
Historic period | 2017-2021 |
Forecast period | 2023-2027 |
Growth momentum & CAGR | Decelerate at a CAGR of 11.23% |
Market growth 2023-2027 | USD 14,124.67 million |
Market structure | Fragmented |
YoY growth 2022-2023 (%) | 14.05 |
Regional analysis | APAC, Europe, North America, South America, and Middle East and Africa |
Performing market contribution | APAC at 37% |
Key countries | US, India, UK, Germany, and Spain |
Competitive landscape | Leading vendors, market positioning of vendors, competitive strategies, and industry risks |
Key companies profiled | betahaus GmbH, Blink Roppongi LLC, Boxer Property, CIC, Convene, Expansive, Firmspace LP, Greendesk LLC, Impact Hub GmbH, Industrious, Knotel Inc., MESH cowork LLC, Regus Group Companies, Servcorp Ltd., Spaces Holding BV, Synergy Office Spaces, The District Coworking and Flex Office, Unicorn Workspaces GmbH, United Franchise Group, and WeWork Inc. |
Market dynamics | Parent market analysis, market growth inducers and obstacles, fast-growing and slow-growing segment analysis, COVID-19 impact and recovery analysis and future consumer dynamics, and market condition analysis for the forecast period. |
Customization purview | If our report has not included the data that you are looking for, you can reach out to our analysts and get segments customized. |
Browse for Technavio's industrials market reports
Table of contents
1 Executive Summary
- 1.1 Market overview
- Exhibit 01: Executive Summary – Chart on Market Overview
- Exhibit 02: Executive Summary – Data Table on Market Overview
- Exhibit 03: Executive Summary – Chart on Global Market Characteristics
- Exhibit 04: Executive Summary – Chart on Market by Geography
- Exhibit 05: Executive Summary – Chart on Market Segmentation by End-user
- Exhibit 06: Executive Summary – Chart on Market Segmentation by Type
- Exhibit 07: Executive Summary – Chart on Incremental Growth
- Exhibit 08: Executive Summary – Data Table on Incremental Growth
- Exhibit 09: Executive Summary – Chart on Vendor Market Positioning
2 Market Landscape
- 2.1 Market ecosystem
- Exhibit 10: Parent market
- Exhibit 11: Market Characteristics
3 Market Sizing
- 3.1 Market definition
- Exhibit 12: Offerings of vendors included in the market definition
- 3.2 Market segment analysis
- Exhibit 13: Market segments
- 3.3 Market size 2022
- 3.4 Market outlook: Forecast for 2022-2027
- Exhibit 14: Chart on Global - Market size and forecast 2022-2027 ($ million)
- Exhibit 15: Data Table on Global - Market size and forecast 2022-2027 ($ million)
- Exhibit 16: Chart on Global Market: Year-over-year growth 2022-2027 (%)
- Exhibit 17: Data Table on Global Market: Year-over-year growth 2022-2027 (%)
4 Historic Market Size
- 4.1 Global coworking spaces market 2017 - 2021
- Exhibit 18: Historic Market Size – Data Table on Global coworking spaces market 2017 - 2021 ($ million)
- 4.2 End-user Segment Analysis 2017 - 2021
- Exhibit 19: Historic Market Size – End-user Segment 2017 - 2021 ($ million)
- 4.3 Type Segment Analysis 2017 - 2021
- Exhibit 20: Historic Market Size – Type Segment 2017 - 2021 ($ million)
- 4.4 Geography Segment Analysis 2017 - 2021
- Exhibit 21: Historic Market Size – Geography Segment 2017 - 2021 ($ million)
- 4.5 Country Segment Analysis 2017 - 2021
- Exhibit 22: Historic Market Size – Country Segment 2017 - 2021 ($ million)
5 Five Forces Analysis
- 5.1 Five forces summary
- Exhibit 23: Five forces analysis - Comparison between 2022 and 2027
- 5.2 Bargaining power of buyers
- Exhibit 24: Chart on Bargaining power of buyers – Impact of key factors 2022 and 2027
- 5.3 Bargaining power of suppliers
- Exhibit 25: Bargaining power of suppliers – Impact of key factors in 2022 and 2027
- 5.4 Threat of new entrants
- Exhibit 26: Threat of new entrants – Impact of key factors in 2022 and 2027
- 5.5 Threat of substitutes
- Exhibit 27: Threat of substitutes – Impact of key factors in 2022 and 2027
- 5.6 Threat of rivalry
- Exhibit 28: Threat of rivalry – Impact of key factors in 2022 and 2027
- 5.7 Market condition
- Exhibit 29: Chart on Market condition - Five forces 2022 and 2027
6 Market Segmentation by End-user
- 6.1 Market segments
- Exhibit 30: Chart on End-user - Market share 2022-2027 (%)
- Exhibit 31: Data Table on End-user - Market share 2022-2027 (%)
- 6.2 Comparison by End-user
- Exhibit 32: Chart on Comparison by End-user
- Exhibit 33: Data Table on Comparison by End-user
- 6.3 Enterprises and SMEs - Market size and forecast 2022-2027
- Exhibit 34: Chart on Enterprises and SMEs - Market size and forecast 2022-2027 ($ million)
- Exhibit 35: Data Table on Enterprises and SMEs - Market size and forecast 2022-2027 ($ million)
- Exhibit 36: Chart on Enterprises and SMEs - Year-over-year growth 2022-2027 (%)
- Exhibit 37: Data Table on Enterprises and SMEs - Year-over-year growth 2022-2027 (%)
- 6.4 Freelancers and start-ups - Market size and forecast 2022-2027
- Exhibit 38: Chart on Freelancers and start-ups - Market size and forecast 2022-2027 ($ million)
- Exhibit 39: Data Table on Freelancers and start-ups - Market size and forecast 2022-2027 ($ million)
- Exhibit 40: Chart on Freelancers and start-ups - Year-over-year growth 2022-2027 (%)
- Exhibit 41: Data Table on Freelancers and start-ups - Year-over-year growth 2022-2027 (%)
- 6.5 Market opportunity by End-user
- Exhibit 42: Market opportunity by End-user ($ million)
7 Market Segmentation by Type
- 7.1 Market segments
- Exhibit 43: Chart on Type - Market share 2022-2027 (%)
- Exhibit 44: Data Table on Type - Market share 2022-2027 (%)
- 7.2 Comparison by Type
- Exhibit 45: Chart on Comparison by Type
- Exhibit 46: Data Table on Comparison by Type
- 7.3 Conventional coworking spaces - Market size and forecast 2022-2027
- Exhibit 47: Chart on Conventional coworking spaces - Market size and forecast 2022-2027 ($ million)
- Exhibit 48: Data Table on Conventional coworking spaces - Market size and forecast 2022-2027 ($ million)
- Exhibit 49: Chart on Conventional coworking spaces - Year-over-year growth 2022-2027 (%)
- Exhibit 50: Data Table on Conventional coworking spaces - Year-over-year growth 2022-2027 (%)
- 7.4 Professional coworking spaces - Market size and forecast 2022-2027
- Exhibit 51: Chart on Professional coworking spaces - Market size and forecast 2022-2027 ($ million)
- Exhibit 52: Data Table on Professional coworking spaces - Market size and forecast 2022-2027 ($ million)
- Exhibit 53: Chart on Professional coworking spaces - Year-over-year growth 2022-2027 (%)
- Exhibit 54: Data Table on Professional coworking spaces - Year-over-year growth 2022-2027 (%)
- 7.5 Others - Market size and forecast 2022-2027
- Exhibit 55: Chart on Others - Market size and forecast 2022-2027 ($ million)
- Exhibit 56: Data Table on Others - Market size and forecast 2022-2027 ($ million)
- Exhibit 57: Chart on Others - Year-over-year growth 2022-2027 (%)
- Exhibit 58: Data Table on Others - Year-over-year growth 2022-2027 (%)
- 7.6 Market opportunity by Type
- Exhibit 59: Market opportunity by Type ($ million)
8 Customer Landscape
- 8.1 Customer landscape overview
- Exhibit 60: Analysis of price sensitivity, lifecycle, customer purchase basket, adoption rates, and purchase criteria
9 Geographic Landscape
- 9.1 Geographic segmentation
- Exhibit 61: Chart on Market share by geography 2022-2027 (%)
- Exhibit 62: Data Table on Market share by geography 2022-2027 (%)
- 9.2 Geographic comparison
- Exhibit 63: Chart on Geographic comparison
- Exhibit 64: Data Table on Geographic comparison
- 9.3 APAC - Market size and forecast 2022-2027
- Exhibit 65: Chart on APAC - Market size and forecast 2022-2027 ($ million)
- Exhibit 66: Data Table on APAC - Market size and forecast 2022-2027 ($ million)
- Exhibit 67: Chart on APAC - Year-over-year growth 2022-2027 (%)
- Exhibit 68: Data Table on APAC - Year-over-year growth 2022-2027 (%)
- 9.4 Europe - Market size and forecast 2022-2027
- Exhibit 69: Chart on Europe - Market size and forecast 2022-2027 ($ million)
- Exhibit 70: Data Table on Europe - Market size and forecast 2022-2027 ($ million)
- Exhibit 71: Chart on Europe - Year-over-year growth 2022-2027 (%)
- Exhibit 72: Data Table on Europe - Year-over-year growth 2022-2027 (%)
- 9.5 North America - Market size and forecast 2022-2027
- Exhibit 73: Chart on North America - Market size and forecast 2022-2027 ($ million)
- Exhibit 74: Data Table on North America - Market size and forecast 2022-2027 ($ million)
- Exhibit 75: Chart on North America - Year-over-year growth 2022-2027 (%)
- Exhibit 76: Data Table on North America - Year-over-year growth 2022-2027 (%)
- 9.6 South America - Market size and forecast 2022-2027
- Exhibit 77: Chart on South America - Market size and forecast 2022-2027 ($ million)
- Exhibit 78: Data Table on South America - Market size and forecast 2022-2027 ($ million)
- Exhibit 79: Chart on South America - Year-over-year growth 2022-2027 (%)
- Exhibit 80: Data Table on South America - Year-over-year growth 2022-2027 (%)
- 9.7 Middle East and Africa - Market size and forecast 2022-2027
- Exhibit 81: Chart on Middle East and Africa - Market size and forecast 2022-2027 ($ million)
- Exhibit 82: Data Table on Middle East and Africa - Market size and forecast 2022-2027 ($ million)
- Exhibit 83: Chart on Middle East and Africa - Year-over-year growth 2022-2027 (%)
- Exhibit 84: Data Table on Middle East and Africa - Year-over-year growth 2022-2027 (%)
- 9.8 US - Market size and forecast 2022-2027
- Exhibit 85: Chart on US - Market size and forecast 2022-2027 ($ million)
- Exhibit 86: Data Table on US - Market size and forecast 2022-2027 ($ million)
- Exhibit 87: Chart on US - Year-over-year growth 2022-2027 (%)
- Exhibit 88: Data Table on US - Year-over-year growth 2022-2027 (%)
- 9.9 India - Market size and forecast 2022-2027
- Exhibit 89: Chart on India - Market size and forecast 2022-2027 ($ million)
- Exhibit 90: Data Table on India - Market size and forecast 2022-2027 ($ million)
- Exhibit 91: Chart on India - Year-over-year growth 2022-2027 (%)
- Exhibit 92: Data Table on India - Year-over-year growth 2022-2027 (%)
- 9.10 UK - Market size and forecast 2022-2027
- Exhibit 93: Chart on UK - Market size and forecast 2022-2027 ($ million)
- Exhibit 94: Data Table on UK - Market size and forecast 2022-2027 ($ million)
- Exhibit 95: Chart on UK - Year-over-year growth 2022-2027 (%)
- Exhibit 96: Data Table on UK - Year-over-year growth 2022-2027 (%)
- 9.11 Germany - Market size and forecast 2022-2027
- Exhibit 97: Chart on Germany - Market size and forecast 2022-2027 ($ million)
- Exhibit 98: Data Table on Germany - Market size and forecast 2022-2027 ($ million)
- Exhibit 99: Chart on Germany - Year-over-year growth 2022-2027 (%)
- Exhibit 100: Data Table on Germany - Year-over-year growth 2022-2027 (%)
- 9.12 Spain - Market size and forecast 2022-2027
- Exhibit 101: Chart on Spain - Market size and forecast 2022-2027 ($ million)
- Exhibit 102: Data Table on Spain - Market size and forecast 2022-2027 ($ million)
- Exhibit 103: Chart on Spain - Year-over-year growth 2022-2027 (%)
- Exhibit 104: Data Table on Spain - Year-over-year growth 2022-2027 (%)
- 9.13 Market opportunity by geography
- Exhibit 105: Market opportunity by geography ($ million)
10 Drivers, Challenges, and Trends
- 10.1 Market drivers
- 10.2 Market challenges
- 10.3 Impact of drivers and challenges
- Exhibit 106: Impact of drivers and challenges in 2022 and 2027
- 10.4 Market trends
11 Vendor Landscape
- 11.1 Overview
- 11.2 Vendor landscape
- Exhibit 107: Overview on Criticality of inputs and Factors of differentiation
- 11.3 Landscape disruption
- Exhibit 108: Overview on factors of disruption
- 11.4 Industry risks
- Exhibit 109: Impact of key risks on business
12 Vendor Analysis
- 12.1 Vendors covered
- Exhibit 110: Vendors covered
- 12.2 Market positioning of vendors
- Exhibit 111: Matrix on vendor position and classification
- 12.3 betahaus GmbH
- Exhibit 112: betahaus GmbH - Overview
- Exhibit 113: betahaus GmbH - Product / Service
- Exhibit 114: betahaus GmbH - Key offerings
- 12.4 Blink Roppongi LLC
- Exhibit 115: Blink Roppongi LLC - Overview
- Exhibit 116: Blink Roppongi LLC - Product / Service
- Exhibit 117: Blink Roppongi LLC - Key offerings
- 12.5 CIC
- Exhibit 118: CIC - Overview
- Exhibit 119: CIC - Product / Service
- Exhibit 120: CIC - Key offerings
- 12.6 Convene
- Exhibit 121: Convene - Overview
- Exhibit 122: Convene - Product / Service
- Exhibit 123: Convene - Key offerings
- 12.7 Expansive
- Exhibit 124: Expansive - Overview
- Exhibit 125: Expansive - Product / Service
- Exhibit 126: Expansive - Key offerings
- 12.8 Firmspace LP
- Exhibit 127: Firmspace LP - Overview
- Exhibit 128: Firmspace LP - Product / Service
- Exhibit 129: Firmspace LP - Key offerings
- 12.9 Impact Hub GmbH
- Exhibit 130: Impact Hub GmbH - Overview
- Exhibit 131: Impact Hub GmbH - Product / Service
- Exhibit 132: Impact Hub GmbH - Key offerings
- 12.10 Industrious
- Exhibit 133: Industrious - Overview
- Exhibit 134: Industrious - Product / Service
- Exhibit 135: Industrious - Key offerings
- 12.11 Knotel Inc.
- Exhibit 136: Knotel Inc. - Overview
- Exhibit 137: Knotel Inc. - Product / Service
- Exhibit 138: Knotel Inc. - Key offerings
- 12.12 Regus Group Companies
- Exhibit 139: Regus Group Companies - Overview
- Exhibit 140: Regus Group Companies - Product / Service
- Exhibit 141: Regus Group Companies - Key offerings
- 12.13 Servcorp Ltd.
- Exhibit 142: Servcorp Ltd. - Overview
- Exhibit 143: Servcorp Ltd. - Business segments
- Exhibit 144: Servcorp Ltd. - Key offerings
- Exhibit 145: Servcorp Ltd. - Segment focus
- 12.14 Spaces Holding BV
- Exhibit 146: Spaces Holding BV - Overview
- Exhibit 147: Spaces Holding BV - Product / Service
- Exhibit 148: Spaces Holding BV - Key offerings
- 12.15 Synergy Office Spaces
- Exhibit 149: Synergy Office Spaces - Overview
- Exhibit 150: Synergy Office Spaces - Product / Service
- Exhibit 151: Synergy Office Spaces - Key offerings
- 12.16 The District Coworking and Flex Office
- Exhibit 152: The District Coworking and Flex Office - Overview
- Exhibit 153: The District Coworking and Flex Office - Product / Service
- Exhibit 154: The District Coworking and Flex Office - Key offerings
- 12.17 WeWork Inc.
- Exhibit 155: WeWork Inc. - Overview
- Exhibit 156: WeWork Inc. - Product / Service
- Exhibit 157: WeWork Inc. - Key news
- Exhibit 158: WeWork Inc. - Key offerings
13 Appendix
- 13.1 Scope of the report
- 13.2 Inclusions and exclusions checklist
- Exhibit 159: Inclusions checklist
- Exhibit 160: Exclusions checklist
- 13.3 Currency conversion rates for US$
- Exhibit 161: Currency conversion rates for US$
- 13.4 Research methodology
- Exhibit 162: Research methodology
- Exhibit 163: Validation techniques employed for market sizing
- Exhibit 164: Information sources
- 13.5 List of abbreviations
- Exhibit 165: List of abbreviations
Technavio is a leading global technology research and advisory company. Their research and analysis focus on emerging market trends and provide actionable insights to help businesses identify market opportunities and develop effective strategies to optimize their market positions. With over 500 specialized analysts, Technavio's report library consists of more than 17,000 reports and counting, covering 800 technologies, spanning across 50 countries. Their client base consists of enterprises of all sizes, including more than 100 Fortune 500 companies. This growing client base relies on Technavio's comprehensive coverage, extensive research, and actionable market insights to identify opportunities in existing and potential markets and assess their competitive positions within changing market scenarios.
Contact
Technavio Research
Jesse Maida
Media & Marketing Executive
US: +1 844 364 1100
UK: +44 203 893 3200
Email: media@technavio.com
Website: www.technavio.com/


SOURCE Technavio
© 2024 Benzinga.com. Benzinga does not provide investment advice. All rights reserved.
Trade confidently with insights and alerts from analyst ratings, free reports and breaking news that affects the stocks you care about.

