- Gold price rebounds from $1,850 key support as yields pullback.
- Gold remains unfazed by the Fed tightening calls after strong US data.
- Gold capitalizes on inflation fears, buyers look to retain control.
Gold price is staging an impressive rebound on Wednesday, having found strong support at the midpoint of the $1,800 level. The renewed upside in gold price comes on the back of a retreat in the US Treasury yields, which has taken the wind out of the dollar’s rally to 16-mnoth highs. Markets remain risk-averse amid growing concerns over inflation, adding to upturn in the inflation hedge, gold. In absence of first-tier US economic data, the dynamics in the yields and the dollar will continue to influence gold price alongside a slew of Fedspeak.
Read: Gold Price Forecast: XAU/USD pullback points to a fresh upswing towards $1,900?
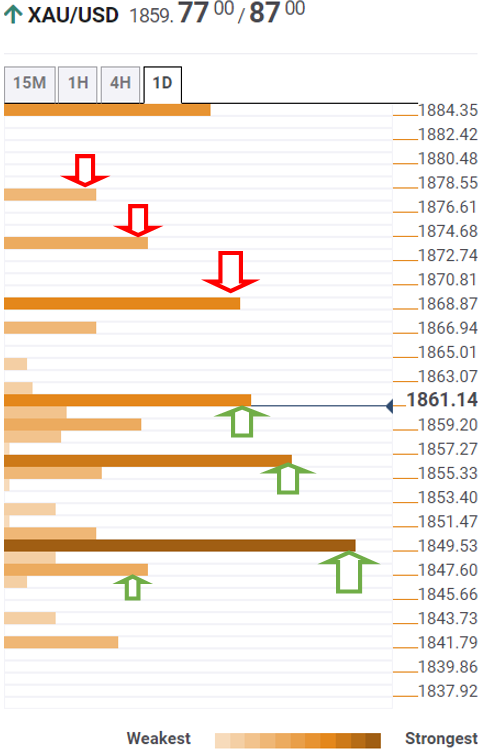
Gold Price: Key levels to watch
The Technical Confluences Detector shows that gold price is eyeing a sustained move above $1,861, which is the convergence of the Fibonacci 38.2% one-day, SMA10 four-hour and SMA100 one-hour.
The next significant upside barrier for gold buyers is seen at $1,869, where the previous week’s high and pivot point one-day R1 coincide.
Acceptance above the latter will expose the Bollinger Band one-day Upper at $1,873, above which the previous day’s high of $1,877 will get challenged.
Alternatively, a firm break below $1,857, the confluence of the Fibonacci 23.6% one-day and one-week, will reinforce the recent bearish momentum towards the pivot point one-month R2 at $1,850.
Minor support of the Fibonacci 38.2% one-week at $1,847 will be the next stop for gold bears.
Here is how it looks on the tool
About Technical Confluences Detector
The TCD (Technical Confluences Detector) is a tool to locate and point out those price levels where there is a congestion of indicators, moving averages, Fibonacci levels, Pivot Points, etc. If you are a short-term trader, you will find entry points for counter-trend strategies and hunt a few points at a time. If you are a medium-to-long-term trader, this tool will allow you to know in advance the price levels where a medium-to-long-term trend may stop and rest, where to unwind positions, or where to increase your position size.
Information on these pages contains forward-looking statements that involve risks and uncertainties. Markets and instruments profiled on this page are for informational purposes only and should not in any way come across as a recommendation to buy or sell in these assets. You should do your own thorough research before making any investment decisions. FXStreet does not in any way guarantee that this information is free from mistakes, errors, or material misstatements. It also does not guarantee that this information is of a timely nature. Investing in Open Markets involves a great deal of risk, including the loss of all or a portion of your investment, as well as emotional distress. All risks, losses and costs associated with investing, including total loss of principal, are your responsibility. The views and opinions expressed in this article are those of the authors and do not necessarily reflect the official policy or position of FXStreet nor its advertisers. The author will not be held responsible for information that is found at the end of links posted on this page.
If not otherwise explicitly mentioned in the body of the article, at the time of writing, the author has no position in any stock mentioned in this article and no business relationship with any company mentioned. The author has not received compensation for writing this article, other than from FXStreet.
FXStreet and the author do not provide personalized recommendations. The author makes no representations as to the accuracy, completeness, or suitability of this information. FXStreet and the author will not be liable for any errors, omissions or any losses, injuries or damages arising from this information and its display or use. Errors and omissions excepted.
The author and FXStreet are not registered investment advisors and nothing in this article is intended to be investment advice.
Recommended content
Editors’ Picks
EUR/USD hovers near 1.0700 even as USD struggles ahead of data

EUR/USD has erased gains to trade flat near 1.0700 in the European session on Thursday. The pair comes under pressure even as the US Dollar struggles, in the aftermath of the Fed policy announcements and ahead of more US employment data.
GBP/USD turns south toward 1.2500, US data eyed

GBP/USD is consolidating the rebound above 1.2500 in European trading on Thursday. The pair struggles, despite the US Dollar weakness on dovish Fed signals. A mixed market mood caps the GBP/USD upside ahead of mid-tier US data.
Gold price pulls back as market sentiment improves

The Gold price is trading in the $2,310s on Thursday after retracing about three-tenths of a percent on reduced safe-haven demand. Market sentiment is overall positive as Asian stocks on balance closed higher and Oil prices hover at seven-week lows.
Top 3 Price Prediction BTC, ETH, XRP: Altcoins to pump once BTC bottoms out, slow grind up for now

Bitcoin reclaiming above $59,200 would hint that BTC has already bottomed out, setting the tone for a run north. Ethereum holding above $2,900 keeps a bullish reversal pattern viable despite falling momentum. Ripple coils up for a move north as XRP bulls defend $0.5000.
Happy Apple day

Apple is due to report Q1 results today after the bell. Expectations are soft given that Apple’s Chinese business got a major hit in Q1 as competitors increased their market share against the giant Apple.