
Advertisement
Advertisement
Bitcoin Price Forecast: Faces Resistance, Potential Bearish Reversal
By:
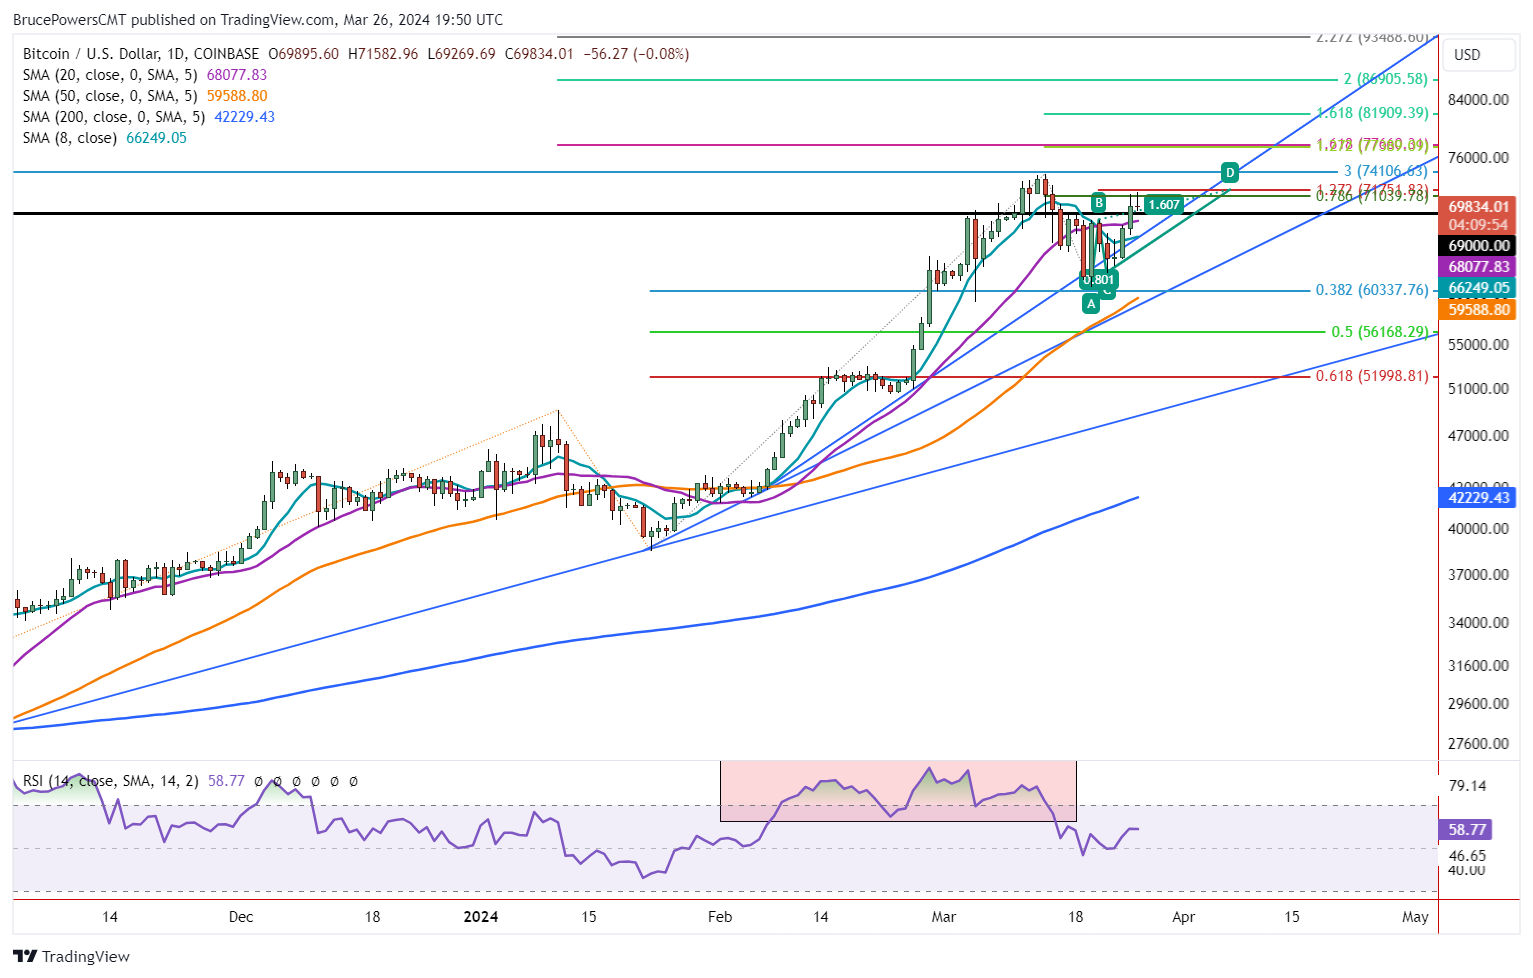
Bitcoin faces potential resistance after hitting target for ABCD pattern at 71,583, with a drop below 69,270 signaling weakness.
Bitcoin rallied to 71,583 on Tuesday thereby hitting a target for a rising ABCD pattern that could lead to weakness. In addition, a 78.6% Fibonacci retracement also completed around that price area at 71,040. Together, these two Fibonacci levels could mark resistance from the bounce that sees Bitcoin head down again. If so, a test of the recent retracement low of 60,771 is possible and probably lower prices as well. In addition, it might mark a second high for a potential double top pattern. Nevertheless, a drop below today’s low of 69,270 is needed for the first sign of weakness on the daily chart.
Extended Price Could Lead to Further Correction
From the most recent swing low of 38,501 in January, Bitcoin rallied 35,335 points or 91.8% to the recent 73,836 record high. That rally occurred over 51 trading days and it put Bitcoin slightly above the prior record high established in November 2021. Subsequently, a head and shoulders top triggered in the relative strength index momentum oscillator (RSI). Also of note is the angle of ascent during Bitcoins advance off the September 2023 lows. You can see how the slope of trendlines defining dynamic support for the uptrend increased over time as the new record high was approached.
Three Trendlines Reflect Overbought Condition
Rising Generally, it is not uncommon to see a notable correction following three trendlines with progressively higher angles defining dynamic support for a trend. Three progressively higher uptrend lines can be seen on the chart as the new trend high is approached. The recent correction to the 60,771-swing low tested support of the third trendline and price was rejected to the upside. If it approached again, it may not hold given the signs of extended price that are showing up, including the RSI, and rising trendlines.
Rally Above Today’s High Maintains Bullish Posture
Nonetheless, a bearish scenario starts to be negated if there is a daily close above today’s high of 71,583. That would be a sign of strength that could lead to an advance above the recent record high. The next higher target would then be 77,270 and 81,910 if it keeps rising. Each is derived from Fibonacci ratio analysis as there is no price history to utilize given the new record high territory.
For a look at all of today’s economic events, check out our economic calendar.
About the Author
Bruce Powersauthor
Bruce boasts over 20 years in financial markets, holding senior roles such as Head of Trading Strategy at Relentless 13 Capital and Corporate Advisor at Chronos Futures. A CMT® charter holder and MBA in Finance, he's a renowned analyst and media figure, appearing on 150+ TV business shows.
Did you find this article useful?
Latest news and analysis


Advertisement