Bitcoin

If these metrics are to believed, Bitcoin might hit an ATH soon
Posted:
| Last updated: March 4th, 2024
Journalist

- Bitcoin realized cap age bands showed holders were beginning to sell.
- This need not be a cause for panic- rather, its a reason to celebrate.
Bitcoin [BTC] embarked on a wild rally over the past five days, climbing from $50.9k to $64k. AMBCrypto found that long-term BTC holders were not yet selling their assets but preferred to HODL.
This was similar to the previous crypto cycles. Furthermore, evidence strongly suggested that the bull run was only just beginning.
Exploring the Realized Cap-UTXO Age Bands
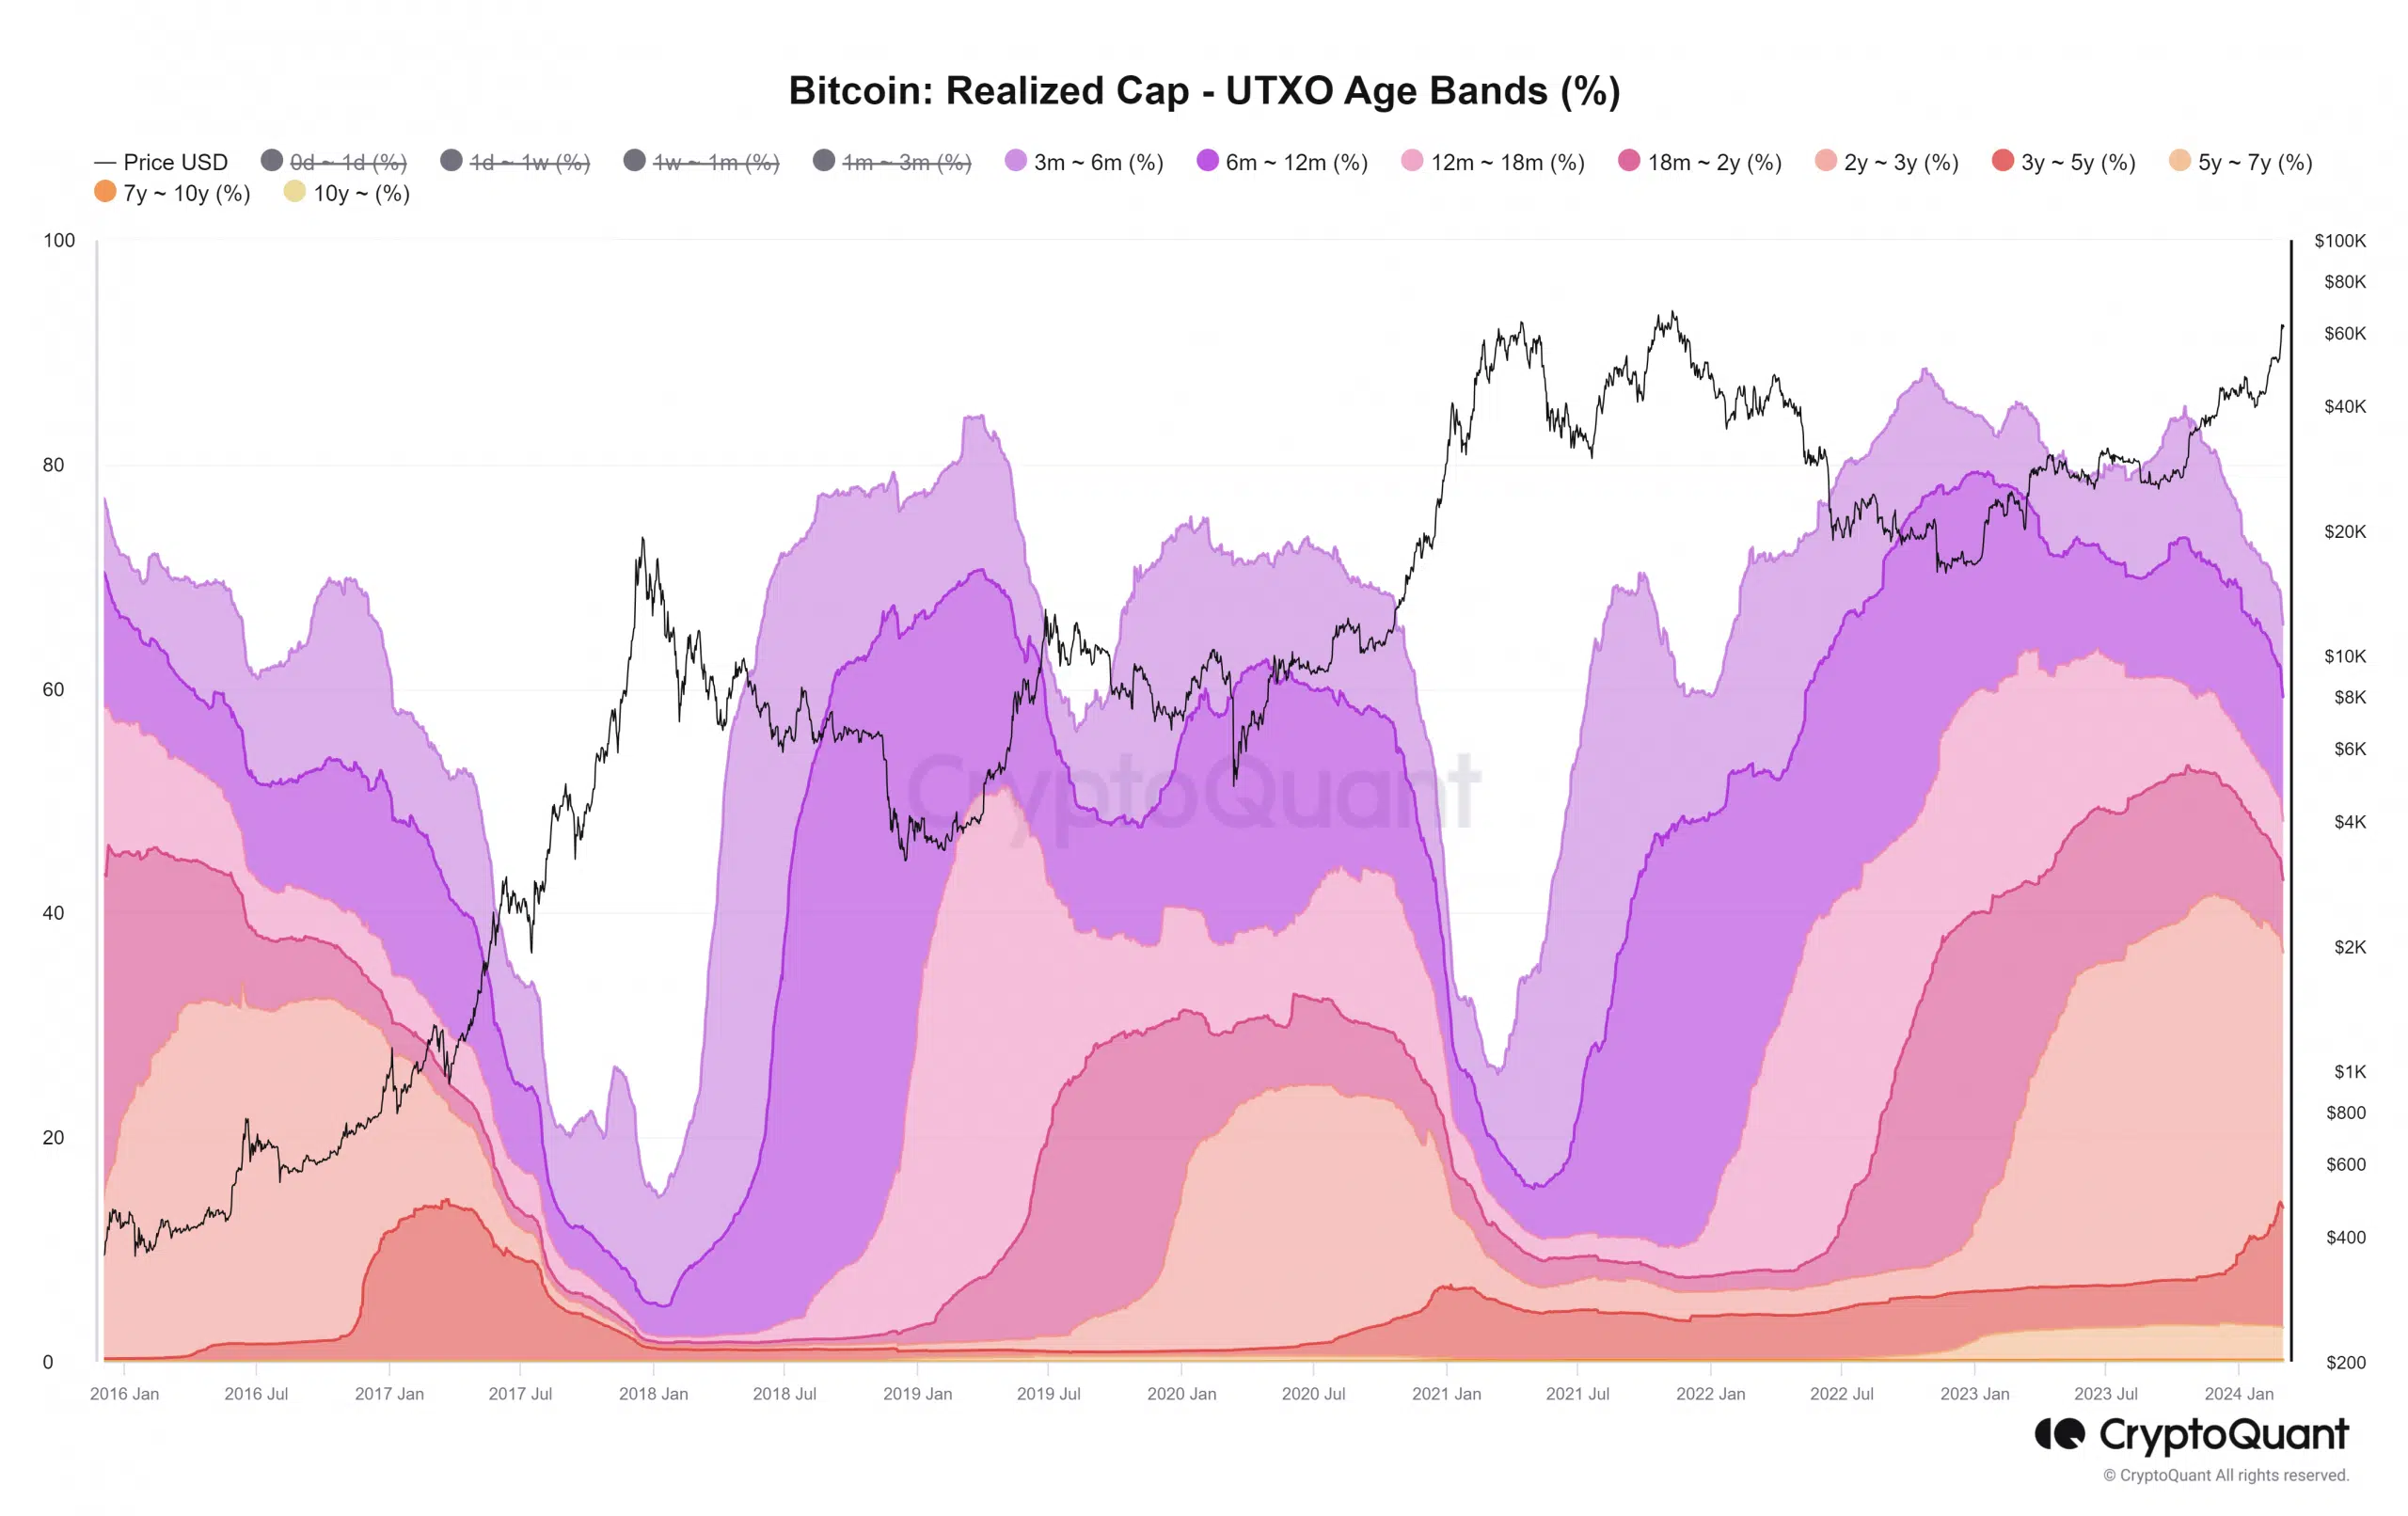
Source: CryptoQuant
This metric shows the distribution of the realized cap of a specified age band. The realized cap is the total value of BTC in circulation if bought at the price each coin last moved at. Each colored band represents the ratio of the realized cap of UTXOs that were last moved in that denoted period.
The chart summarizes the capitalization held by short-term and long-term holders. The second half of 2017’s bull run saw the age bands of everyone from 3 months to 5 years trend downward.
Similarly, 2021 also saw a similar downtrend. The rationale is simple—more new investors are flowing in, and this rapid influx will lead to the bull run intensifying.
While it’s not possible to point out when the bull run would end using this metric, it’s relatively easy to spot its beginning.
The rapid pace at which 3 to 6-month holders and the 6 to 12-month holders age bands declined since mid-January is similar to the bulls runs of 2017 and 2021.
There is a long way to go yet
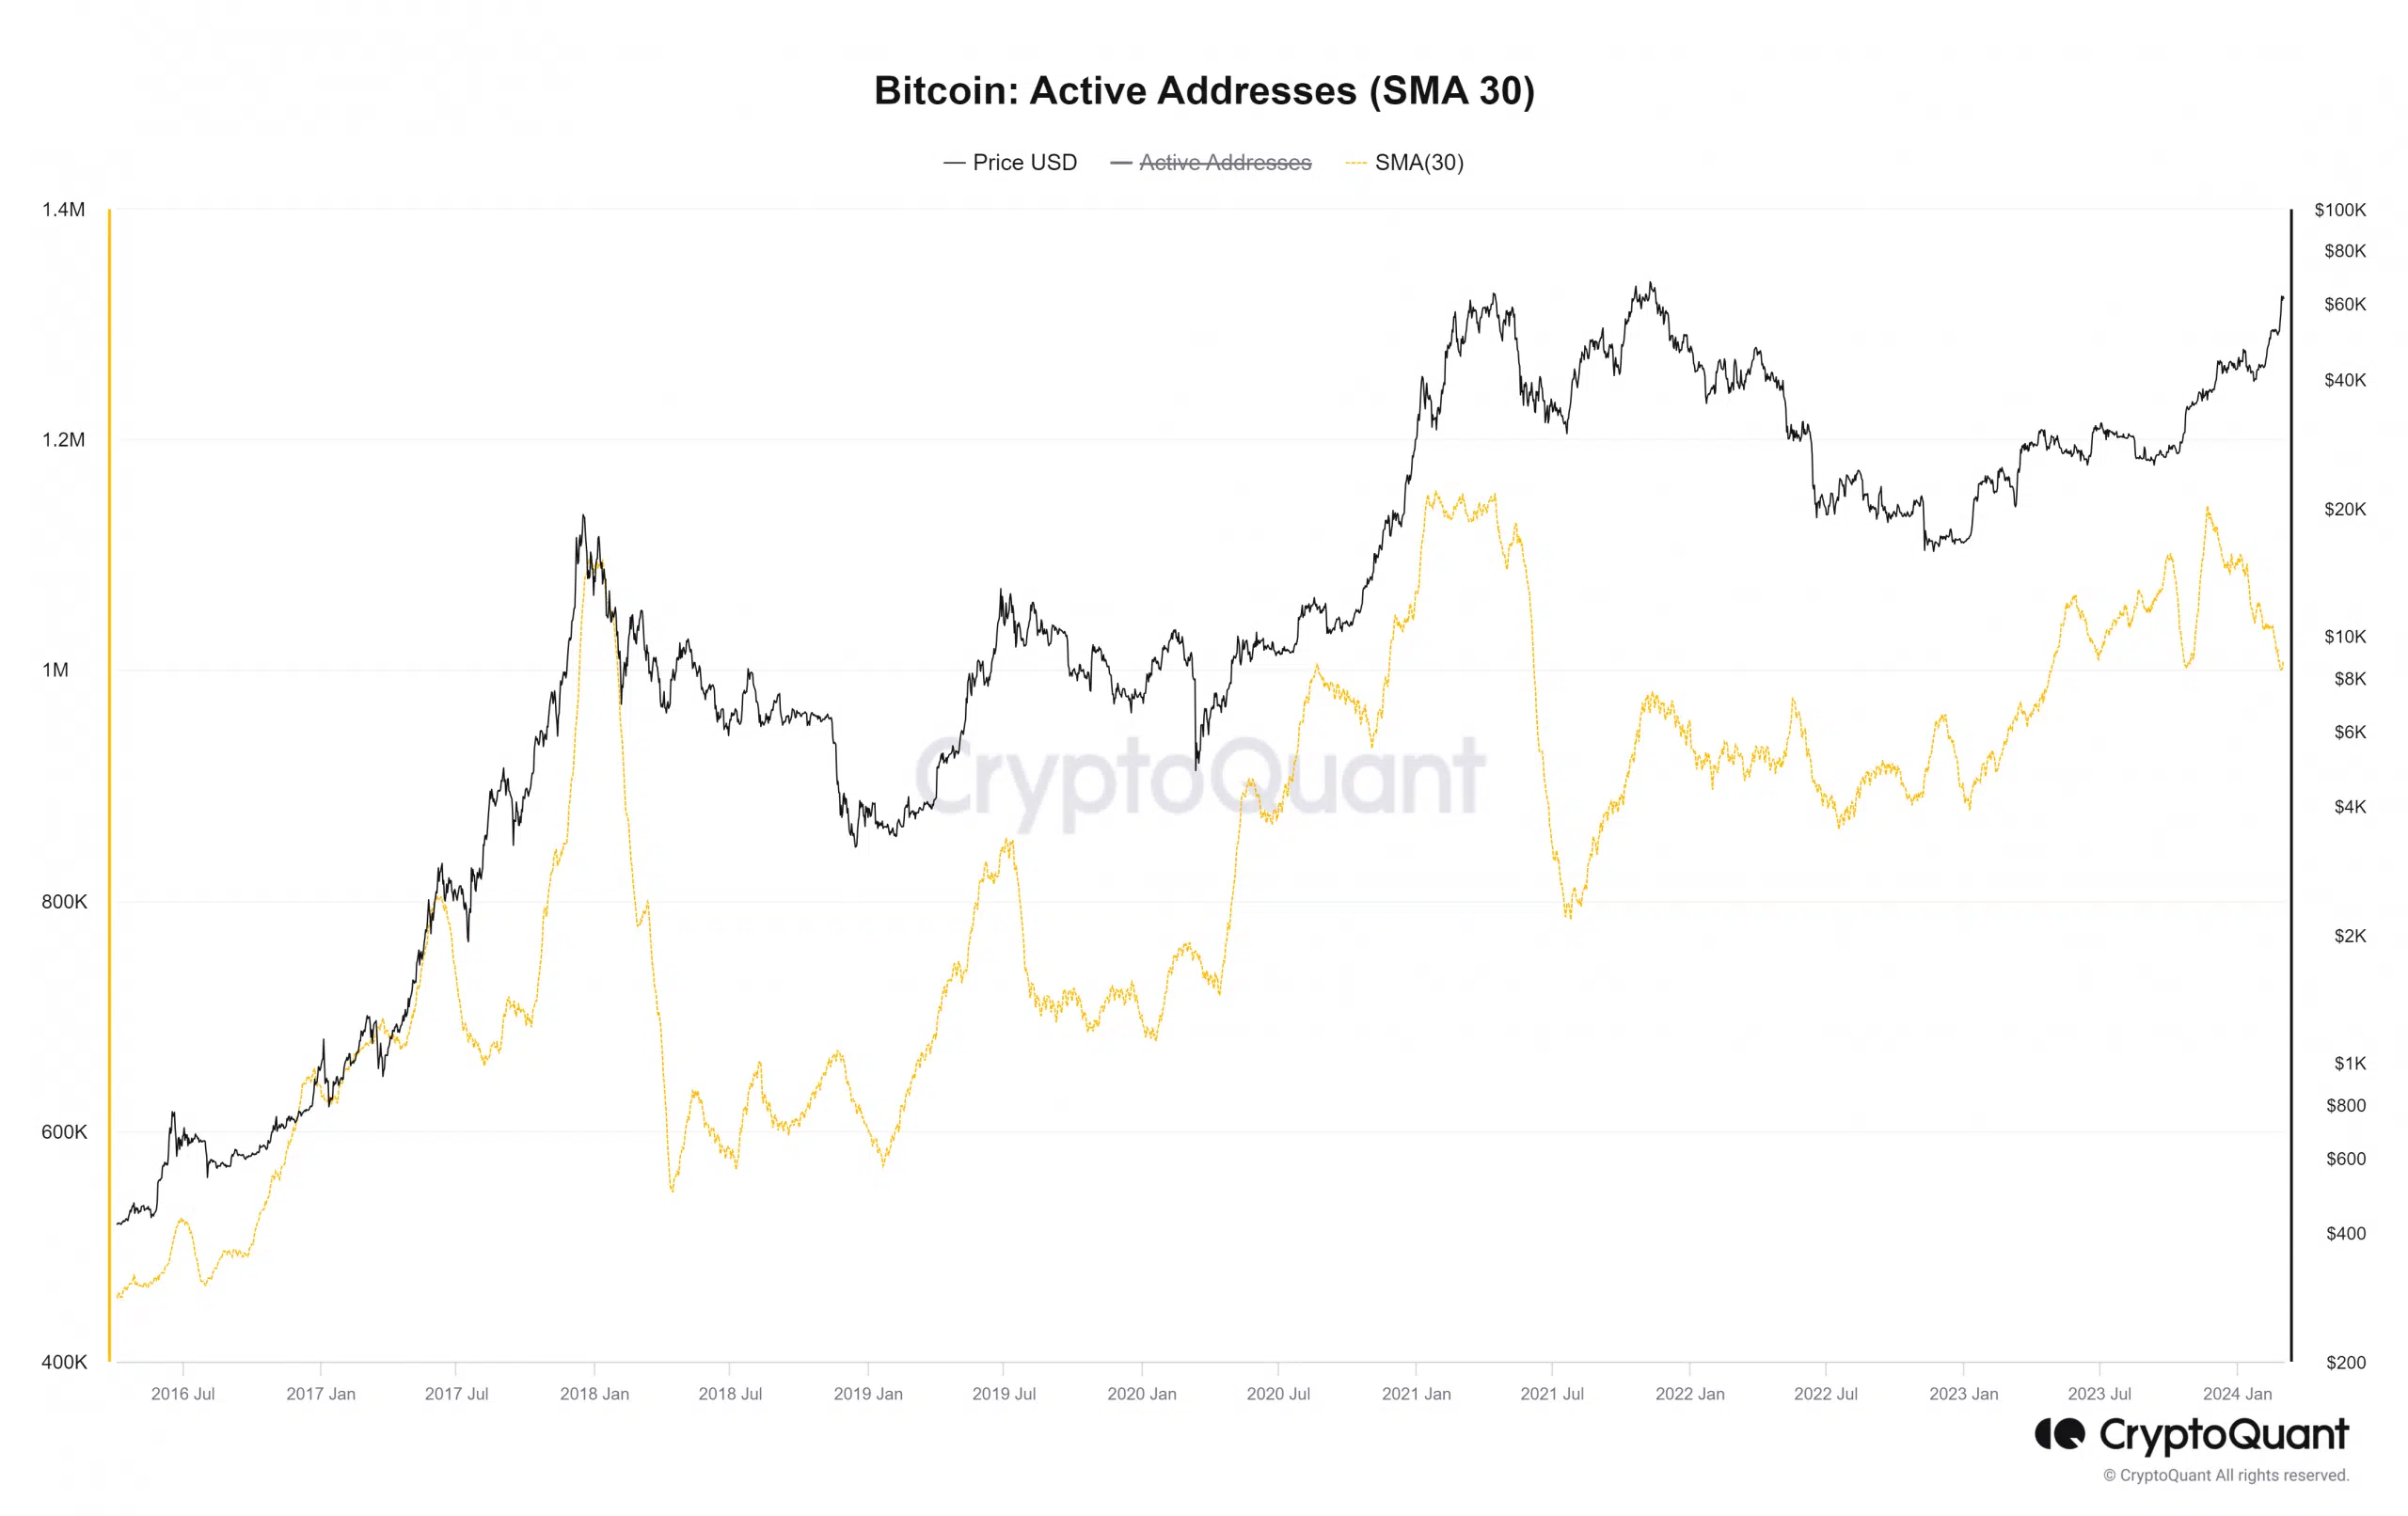
Source: CryptoQuant
The active addresses count nearly reached the 2021 high in November. However, the chart above shows the 30-day simple moving average. The SMA has since trended downward even as prices rocketed higher.
In the past, active addresses increased alongside prices. Naturally, Bitcoin would attract more users as its popularity grew with its price. This was another sign that the higher time horizon uptrend was just beginning.
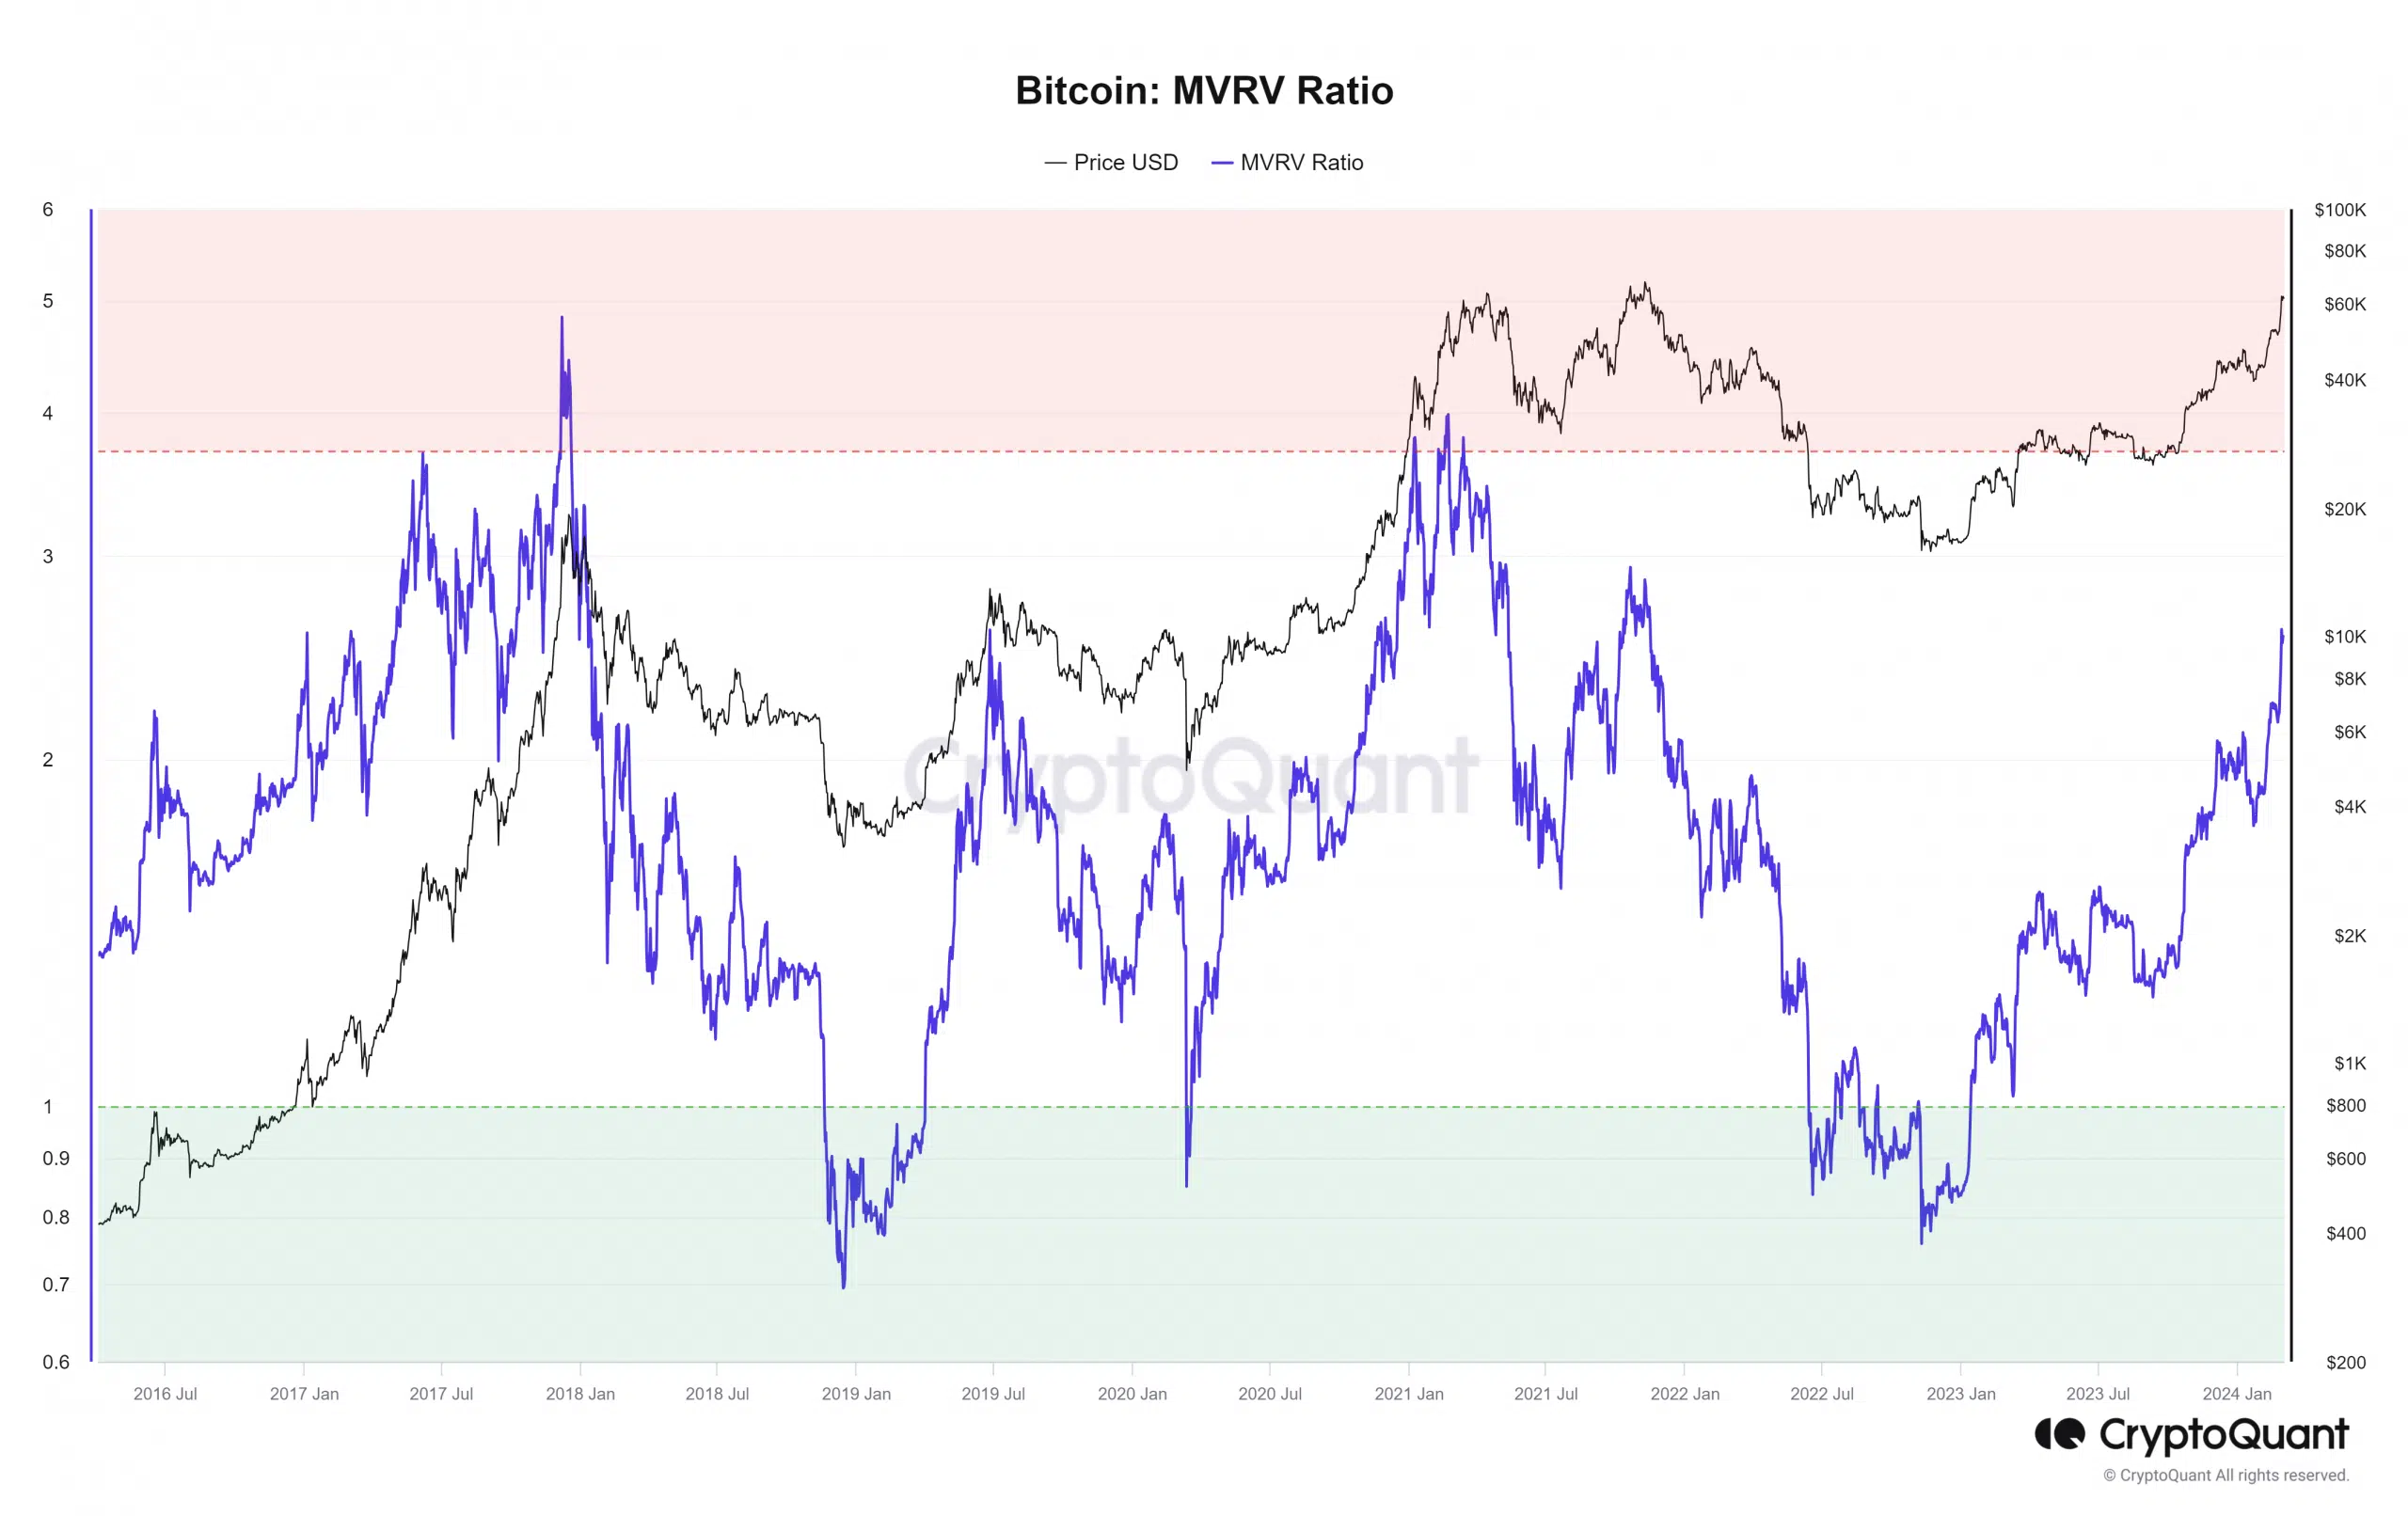
Source: CryptoQuant
The MVRV ratio reached 2.59, a value not seen since November 2021. The 3.7 level would indicate that the run was likely at an end. As things stand, there is plenty of space and time for the MVRV to climb higher.
Is your portfolio green? Check the Bitcoin Profit Calculator
Any pullbacks and significant corrections along the way are to be welcomed. They likely represent discounts on Bitcoin. In 2019, prices reached $12k but the MVRV was no higher than 2.6.
While such a black swan event like coronavirus might not repeat, the inference remains the same- there is a long way to go for Bitcoin’s price discovery in this run.