
Advertisement
Advertisement
Nasdaq 100 Index, Dow Jones, S&P 500 News: Dow Enters Negative Territory for 2023 as Labor Market Strengthens
By:
US stock futures dip as Dow enters 2023's red zone amid inflation concerns; investors eye labor and economic data before Friday's Non-Farm Payrolls.

In this article:
Highlights
- Dow Jones slips into 2023’s red zone, after futures falter in early Wednesday trading.
- JOLTS data rattles investors, showing a bullish 9.6 million job vacancies in August.
- Treasury yields surge to a 16-year peak, pushing 30-year fixed mortgage rates towards 8%.
- Short-term outlook for U.S. equities turns bearish amid strong labor market and rising bond yields.
US Stock Futures Dip as Investors Weigh Inflation Concerns and Strong Job Market
The Dow Jones tumbled into the negative territory for 2023 after U.S. stock futures dipped in early Wednesday trading. While the Dow slipped 0.07%, the S&P 500 and Nasdaq futures fell 0.19% and 0.32%, respectively. The drop comes on the heels of a brutal session that saw Dow’s worst performance since March.
Bond Yields and Job Openings Stir Market Nerves
Investors were rattled by Tuesday’s August job openings data, which exceeded expectations, coupled with bond yields reaching their highest level since 2007.
The Job Openings and Labor Turnover Survey (JOLTS) reported 9.6 million job vacancies, outpacing the consensus estimate of 8.8 million. The higher-than-anticipated job openings fueled concerns that the Federal Reserve might not be close to concluding its rate-hiking cycle, contradicting investor sentiment. Treasury yields were also up, with the 30-year fixed mortgage rate nearing 8%.
Stock Indices Paint a Mixed Picture for 2023
While the Dow sank into the red for 2023, losing 0.4%, the S&P 500 and Nasdaq have performed substantially better, posting gains of over 10% and 24% respectively for the year. The indices’ contrasting fortunes underscore the complex factors shaping equity performance, with interest rates acting as the primary driver for the past couple of months.
Labor and Economic Data in the Spotlight
Investors are eyeing this week’s labor market indicators keenly. The highly anticipated Non-Farm Payrolls report is due on Friday, but before that, traders will scrutinize today’s ADP’s private payroll data, due to be released at 12:30 GMT, and the weekly jobless claims report on Thursday. Additionally, economic data on purchasing and housing orders are on the slate for Wednesday.
Short-term Outlook: Bearish
Given the strong job market figures and rising bond yields, the short-term outlook for U.S. equities remains bearish. Until clarity emerges on the Federal Reserve’s next moves and a host of economic data releases, caution is likely to prevail in the trading community.
Technical Analysis
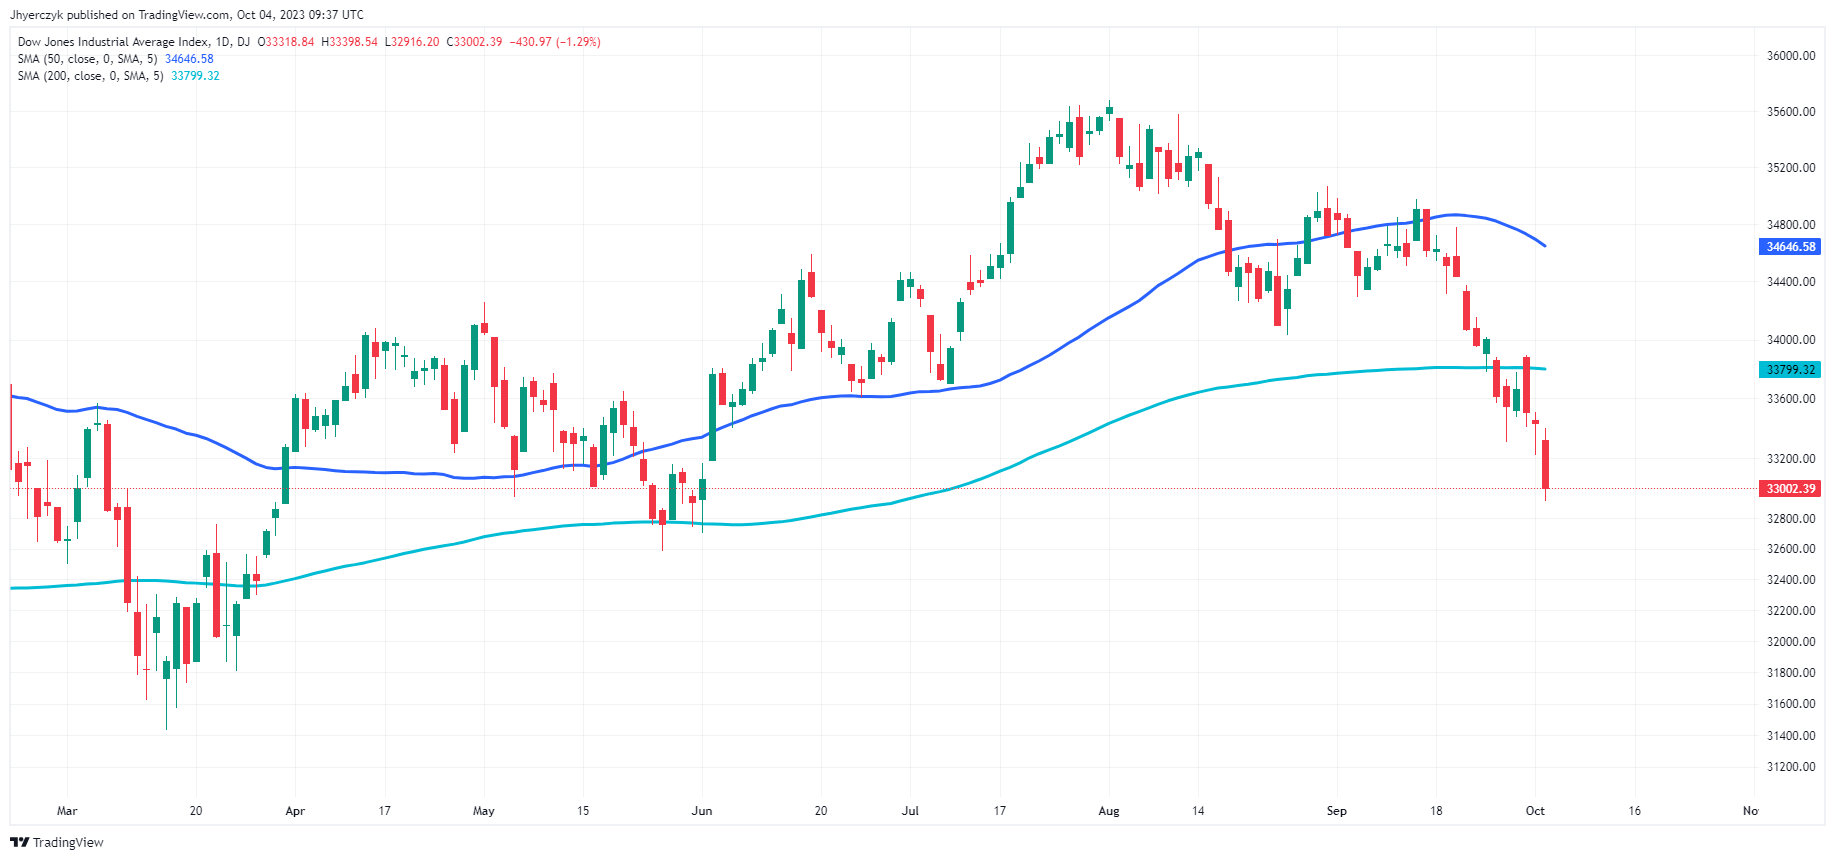
Based on the daily chart data for the Dow Jones Industrial Average, the current price of 33,002.39 is below both the 200-Day moving average at 33,799.32 and the 50-Day moving average at 34,646.58. This suggests a short-term bearish sentiment as the index is trading below its key moving averages.
Given these technical indicators, the current market sentiment appears to be bearish, with potential downside pressure.
About the Author
James Hyerczykauthor
James is a Florida-based technical analyst, market researcher, educator and trader with 35+ years of experience. He is an expert in the area of patterns, price and time analysis as it applies to futures, Forex, and stocks.
Did you find this article useful?
Latest news and analysis


Advertisement