- The Dow Jones is the best of the indexes on Monday.
- S&P 500, NASDAQ slightly in the red as Dow Jones holds steady.
- Markets gear up for US CPI inflation on Tuesday.
The Dow Jones Industrial Average (DJIA) is up on thin margins for Monday, trading on the high side of 38,500.00 as its counterpart indexes are slightly softer on the day. Investors are buckling down for Tuesday’s US Consumer Price Index (CPI) inflation print, and investors will be looking for easing price growth to signal the approach of rate cuts from the US Federal Reserve (Fed).
Dow Jones News: Markets spread as investors await the next iteration of US CPI inflation
The Materials and Energy Sectors are Monday’s top performers halfway through the day’s trading session, up 1.1% and 0.56% respectively. On the low side, Industrials and Real Estate are both i nthe red about six tenths of a percent on Monday.
The DJIA’s top performers are UnitedHealth Group Inc. (UNH) and Nike Inc. (NKE), neck-and-neck at 2.5% apiece, closely followed by Walt Disney Co. (DIS), up 2% on Monday. The Dow Jones’ worst performer is Boeing Co. (BA), shedding 3.3%,
Boeing, beleaguered by multiple crashes and investigations in recent years, is once again slated to be the subject of a DOJ criminal investigation after a mishap with an Alaska Airlines flight could have been catastrophic. Boeing was forced to admit they could not find a maintenance record for the plane following the blowout that saw a panel fall off the plane mid-flight.
US CPI inflation in the crosshairs
Tuesday brings US inflation figures, and investors will be looking for signs that US price growth is cooling enough to push the Fed closer to making rate cuts. According to the CME’s FedWatch Tool, rate markets are pricing in nearly 70% odds of a first rate cut from the Fed at the June policy meeting.
US CPI Preview: Forecasts from 10 major banks, inflation still too high
February’s MoM US CPI is expected to tick upwards to 0.4% from 0.3% as lopsided inflation continues to weigh on the Fed’s rate cut outlook. Core MoM CPI is forecast to tick down to 0.3% from the previous 0.4%. YoY CPI is expected to hold steady at 3.1% with Core annualized CPI forecast to print at 3.7%, down slightly from 3.9%.
Dow Jones technical outlook
The Dow Jones Industrial Average (DJIA) grinds higher on Monday, climbing into 38,775.00 after bottoming out near 38,475.00 early in the day. The Dow Jones remains on the low side of last week’s peaks near 38,960.00.
The DJIA remains down from all-time peaks above 39,200.00 set in February, but a near-term floor sees the index trading north of the 50-day Simple Moving Average (SMA) at 38,295.00. The DJIA has outrun the 50-day and 200-day SMAs since crossing into bull country back in November.
Dow Jones chart, 1-minute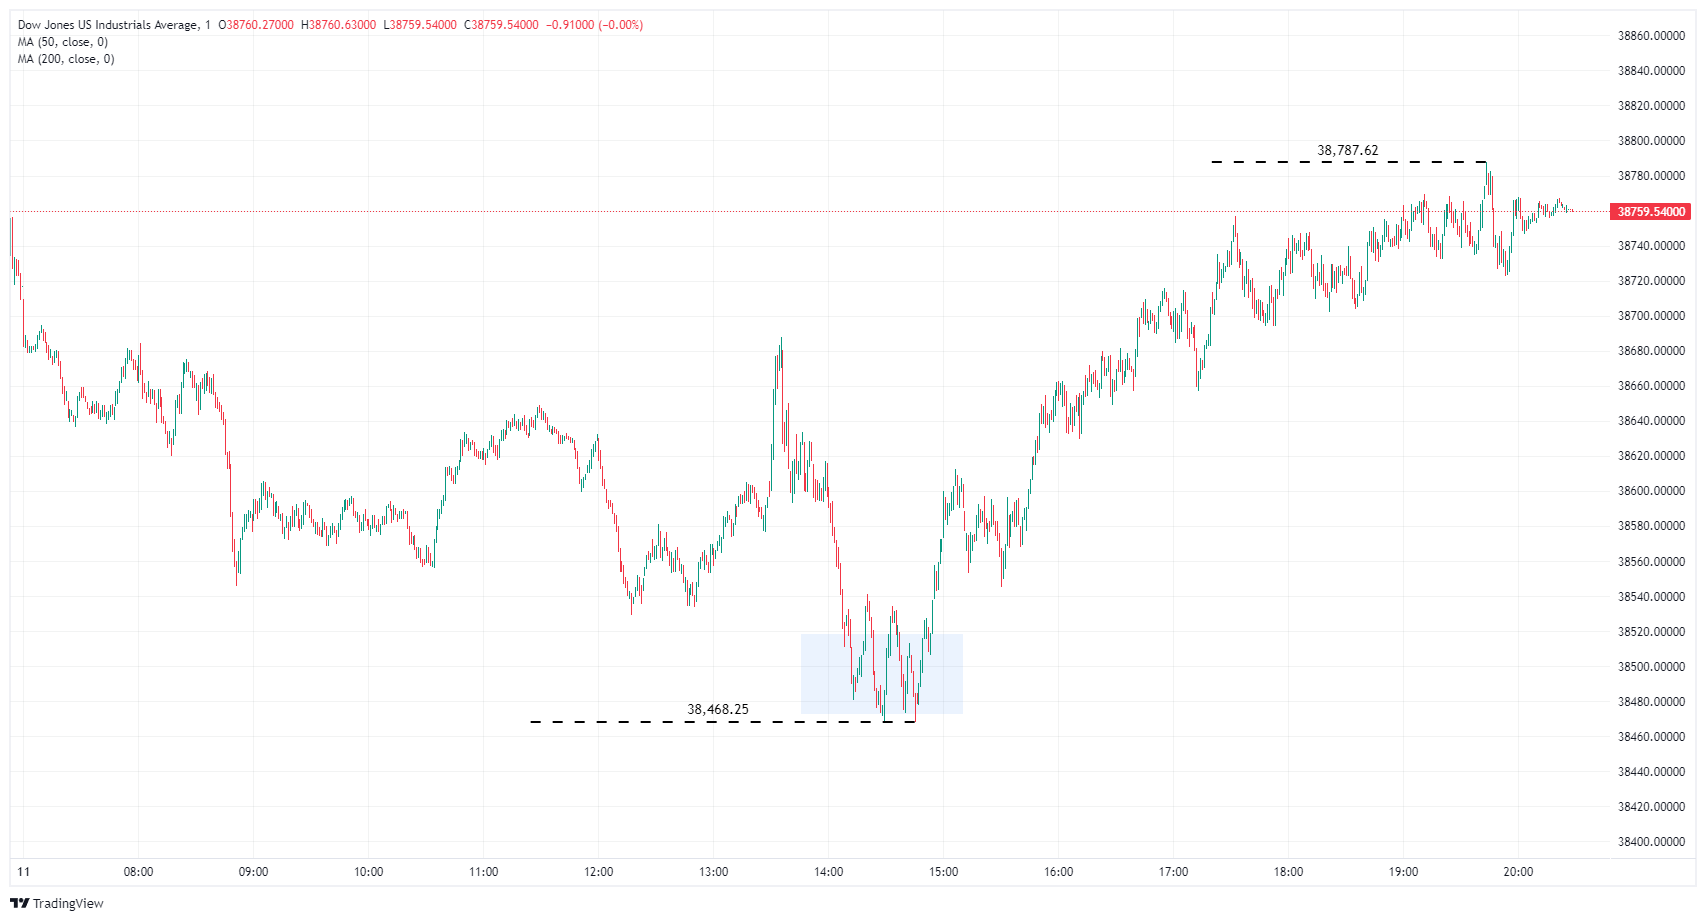
Dow Jones FAQs
The Dow Jones Industrial Average, one of the oldest stock market indices in the world, is compiled of the 30 most traded stocks in the US. The index is price-weighted rather than weighted by capitalization. It is calculated by summing the prices of the constituent stocks and dividing them by a factor, currently 0.152. The index was founded by Charles Dow, who also founded the Wall Street Journal. In later years it has been criticized for not being broadly representative enough because it only tracks 30 conglomerates, unlike broader indices such as the S&P 500.
Many different factors drive the Dow Jones Industrial Average (DJIA). The aggregate performance of the component companies revealed in quarterly company earnings reports is the main one. US and global macroeconomic data also contributes as it impacts on investor sentiment. The level of interest rates, set by the Federal Reserve (Fed), also influences the DJIA as it affects the cost of credit, on which many corporations are heavily reliant. Therefore, inflation can be a major driver as well as other metrics which impact the Fed decisions.
Dow Theory is a method for identifying the primary trend of the stock market developed by Charles Dow. A key step is to compare the direction of the Dow Jones Industrial Average (DJIA) and the Dow Jones Transportation Average (DJTA) and only follow trends where both are moving in the same direction. Volume is a confirmatory criteria. The theory uses elements of peak and trough analysis. Dow’s theory posits three trend phases: accumulation, when smart money starts buying or selling; public participation, when the wider public joins in; and distribution, when the smart money exits.
There are a number of ways to trade the DJIA. One is to use ETFs which allow investors to trade the DJIA as a single security, rather than having to buy shares in all 30 constituent companies. A leading example is the SPDR Dow Jones Industrial Average ETF (DIA). DJIA futures contracts enable traders to speculate on the future value of the index and Options provide the right, but not the obligation, to buy or sell the index at a predetermined price in the future. Mutual funds enable investors to buy a share of a diversified portfolio of DJIA stocks thus providing exposure to the overall index.
Information on these pages contains forward-looking statements that involve risks and uncertainties. Markets and instruments profiled on this page are for informational purposes only and should not in any way come across as a recommendation to buy or sell in these assets. You should do your own thorough research before making any investment decisions. FXStreet does not in any way guarantee that this information is free from mistakes, errors, or material misstatements. It also does not guarantee that this information is of a timely nature. Investing in Open Markets involves a great deal of risk, including the loss of all or a portion of your investment, as well as emotional distress. All risks, losses and costs associated with investing, including total loss of principal, are your responsibility. The views and opinions expressed in this article are those of the authors and do not necessarily reflect the official policy or position of FXStreet nor its advertisers. The author will not be held responsible for information that is found at the end of links posted on this page.
If not otherwise explicitly mentioned in the body of the article, at the time of writing, the author has no position in any stock mentioned in this article and no business relationship with any company mentioned. The author has not received compensation for writing this article, other than from FXStreet.
FXStreet and the author do not provide personalized recommendations. The author makes no representations as to the accuracy, completeness, or suitability of this information. FXStreet and the author will not be liable for any errors, omissions or any losses, injuries or damages arising from this information and its display or use. Errors and omissions excepted.
The author and FXStreet are not registered investment advisors and nothing in this article is intended to be investment advice.
Recommended content
Editors’ Picks
EUR/USD edges lower toward 1.0700 post-US PCE

EUR/USD stays under modest bearish pressure but manages to hold above 1.0700 in the American session on Friday. The US Dollar (USD) gathers strength against its rivals after the stronger-than-forecast PCE inflation data, not allowing the pair to gain traction.
GBP/USD retreats to 1.2500 on renewed USD strength

GBP/USD lost its traction and turned negative on the day near 1.2500. Following the stronger-than-expected PCE inflation readings from the US, the USD stays resilient and makes it difficult for the pair to gather recovery momentum.
Gold struggles to hold above $2,350 following US inflation

Gold turned south and declined toward $2,340, erasing a large portion of its daily gains, as the USD benefited from PCE inflation data. The benchmark 10-year US yield, however, stays in negative territory and helps XAU/USD limit its losses.
Bitcoin Weekly Forecast: BTC’s next breakout could propel it to $80,000 Premium

Bitcoin’s recent price consolidation could be nearing its end as technical indicators and on-chain metrics suggest a potential upward breakout. However, this move would not be straightforward and could punish impatient investors.
Week ahead – Hawkish risk as Fed and NFP on tap, Eurozone data eyed too

Fed meets on Wednesday as US inflation stays elevated. Will Friday’s jobs report bring relief or more angst for the markets? Eurozone flash GDP and CPI numbers in focus for the Euro.