
Bitcoin (BTC) is once again trading above the $70,000 mark after avoiding dropping below $60,000. With the ongoing resurgence, investor attention remains fixated on whether BTC will rally and achieve another record high before the April halving event.
Indeed, a significant portion of market attention is focused on Bitcoin’s ability to hit a six-figure mark, and crypto analyst TradingShot believes the maiden digital asset has a strong chance in the current cycle.
In a TradingView post on March 28, the analyst suggested that the asset has the potential to reach $200,000, despite experiencing a two-week consolidation period after surpassing its previous all-time high.
Picks for you
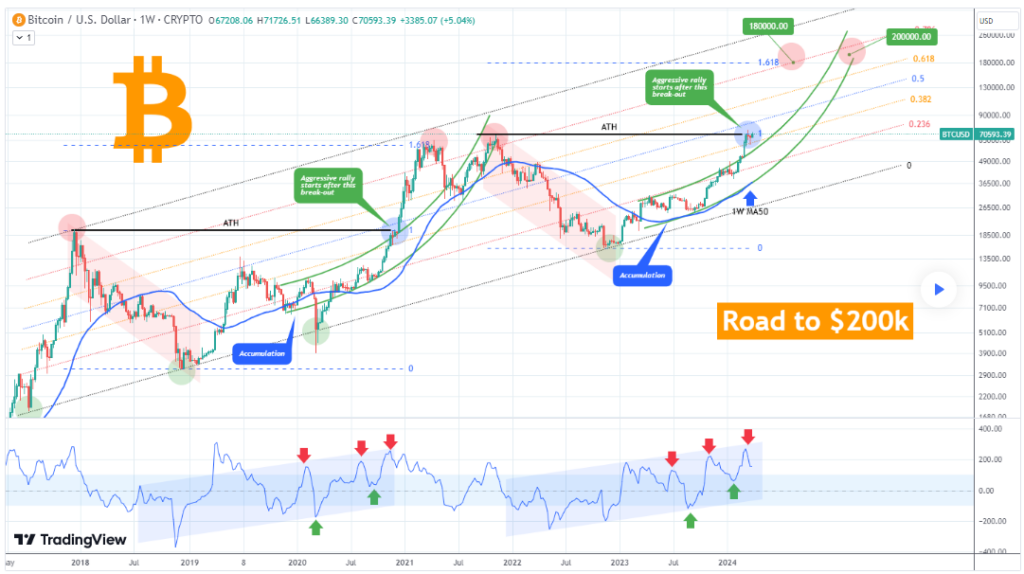
In his view, Bitcoin has exhibited remarkable resilience, echoing a pattern observed during its previous cycle in November 2020 where it similarly underwent a three-week sideways trading phase following its ATH breakthrough. Some of the similarities emerge in the price movements and technical indicators, particularly on the weekly Commodity Channel Index (CCI).
Bitcoin’s next targets
These resemblances reinforce the notion that Bitcoin has exhibited a consistent pattern of a “Channel Up” over the past seven years, with Fibonacci retracement levels providing insights into the symmetry of its trends.
“As a result, we are expecting a parabolic rally to break-out soon, with a first Target on the 1.618 Fib at $180,000. If the same “Double Top” formation is followed, we can even see a Blow-off Top as high as $200,000,” he said.
However, he cautioned that the targets remain below the 0.786 Fibonacci level of the channel. While a conservative estimate places Bitcoin’s peak during this cycle at $200,000, adhering to the standard higher high pattern of channel ups could see prices surge even further, potentially reaching $300,000.
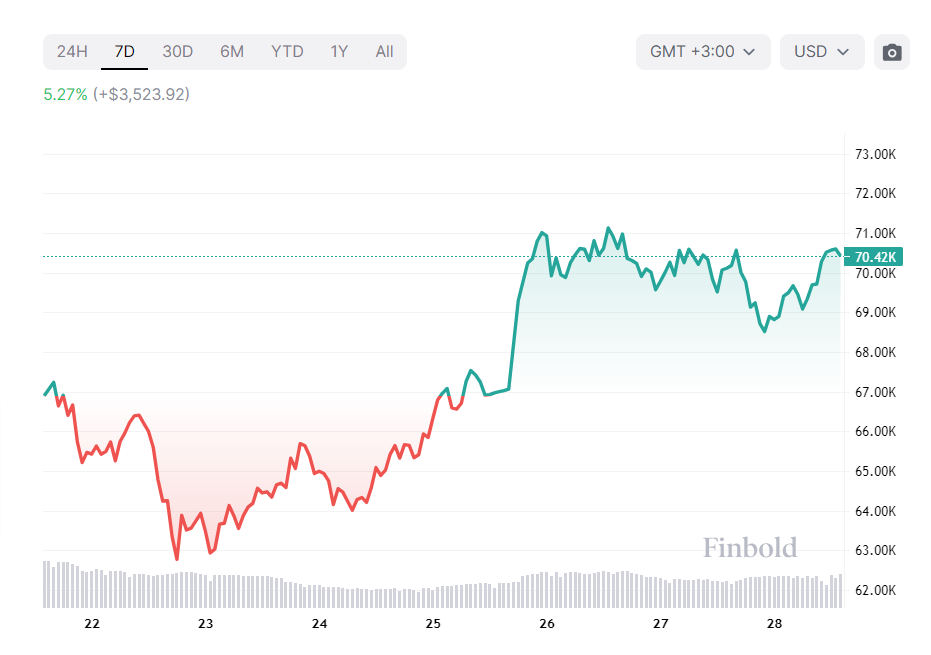
It is worth noting that after days of ascent, Bitcoin reached a weekly peak of nearly $71,200 before consolidating its gains. This trajectory in price followed a notable shift as spot Bitcoin exchange-traded funds (ETFs) concluded a five-day streak of outflows.
Bitcoin price analysis
By press time, Bitcoin was trading at $70,612 with 24-hour gains of almost 1%. Over the past week, BTC is up 5%.
In the meantime, there is no doubt that Bitcoin has exhibited resilience after retracting in what the market observed as a ‘pre-halving retrace’. However, the asset now faces formidable challenges in retaining its valuation above $70,000.
Disclaimer: The content on this site should not be considered investment advice. Investing is speculative. When investing, your capital is at risk.