
Advertisement
Advertisement
Bitcoin News Today: Unveiling MicroStrategy’s Role in BTC’s Financial Odyssey
By:
Key Points:
- BTC declined by 0.70% on Monday, ending the session at $51,812.
- On Tuesday, investors must continue monitoring BTC-spot ETF market flow data. The US markets were closed on Monday for President’s Day.
- US lawmaker chatter and SEC activity also warrant investor attention.

In this article:
BTC Investors Await Post-Holiday BTC-Spot ETF Flows
On Monday, BTC declined by 0.70%. Partially reversing a 0.93% gain from Sunday, BTC ended the session at $51,812.
BTC-spot ETF market flow data remains the focal point for investors. BTC trends over the US holiday weekend highlighted a lack of investor conviction following a BTC climb to $52,868 on Thursday. Last week, BTC revisited the $52,000 handle for the first time since December 2021.
BTC-spot ETF market inflows increased by $2,271 million in the week ending February 16, up from net inflows of $1,194 million in the previous week.
On Tuesday, BTC-spot ETF market flows could influence buyer demand for BTC and the broader market.
While the US markets were closed on Monday, BlackRock (BLK) continued to take steps to strengthen its number-one ranking in the BTC-spot ETF market.
Bitcoin ETF adverts archives shared the latest iShares Bitcoin Trusts (IBIT) ad. BlackRock targeted prospective BTC-spot ETF investors, saying,
“Bitcoin ETFs have landed. IBIT, the iShares Bitcoin Trust, now lets you access Bitcoin where you get your stocks and bonds so you can manage all your investments in one place.”
An active advertising campaign has propelled net IBIT inflows to $5,365 million, leaving Fidelity Wise Origin Fund (FBTC) a distant second, with net inflows of $3,652 million.
BTC Returns Remain the Center of Attraction
On Monday, MicroStrategy (MSTR) founder and Chairman Michael Saylor shared MSTR and BTC returns since MSTR famously adopted its BTC investment strategy on August 10, 2020. Significantly, MSTR and BTC outperformed the S&P 500 despite the 500 breaking the 5,000 barrier in early 2024.
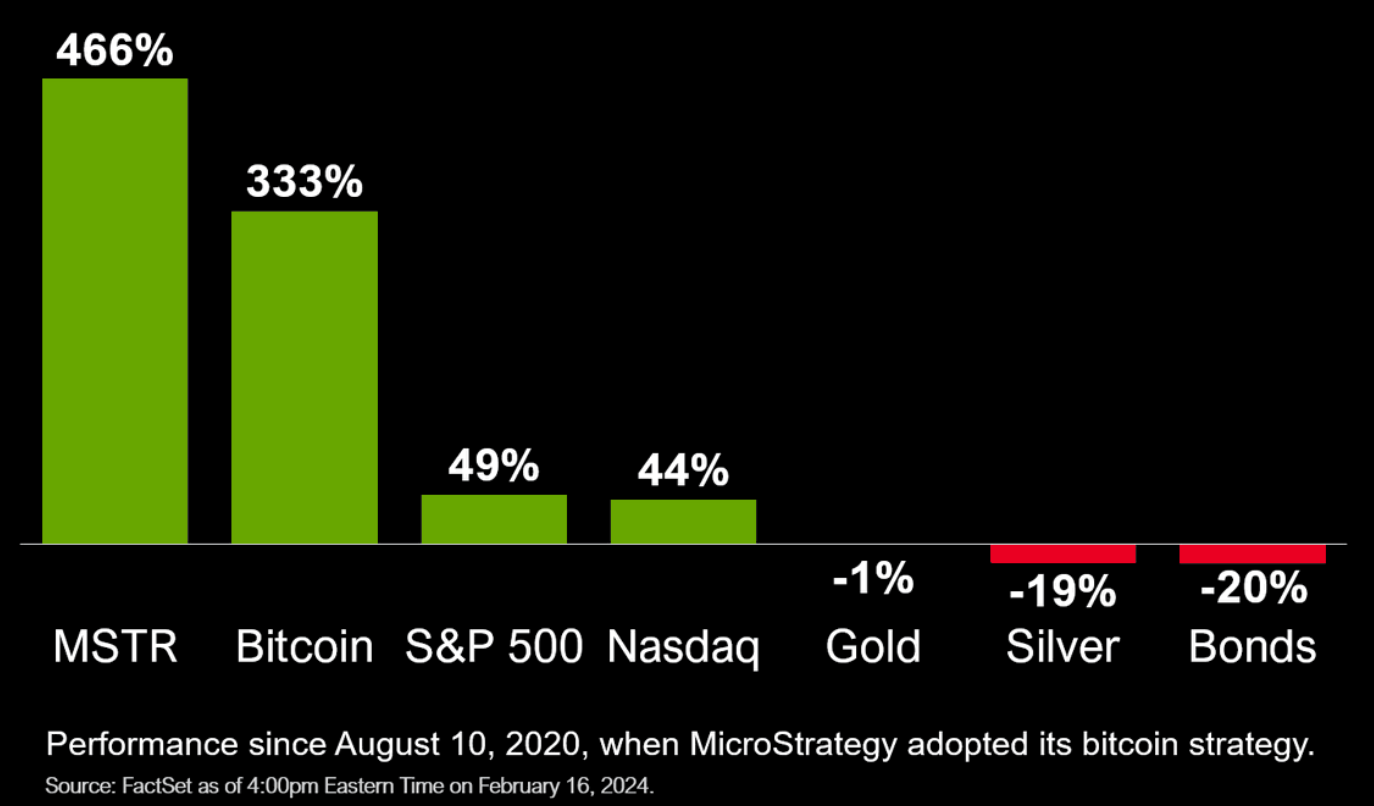
In contrast, BTC remains well below the November 2021 all-time high of $69,071. While there are arguments the BTC-spot ETF market could give the SEC more oversight powers, BTC-spot ETF market flows are not the only consideration for prospective BTC investors.
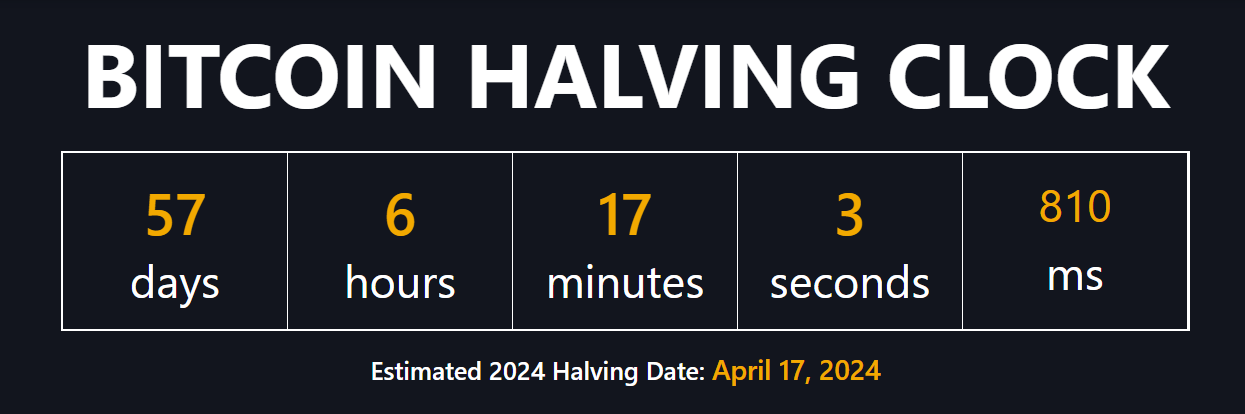
Increased demand from self-custody investors could limit the SEC’s influence on BTC and the broader market. The upcoming Bitcoin halving event could be a telling moment. A sustainable demand environment could limit BTC-spot ETF market access to available BTC and further pressure the supply and demand equilibrium.
Technical Analysis
Bitcoin Analysis
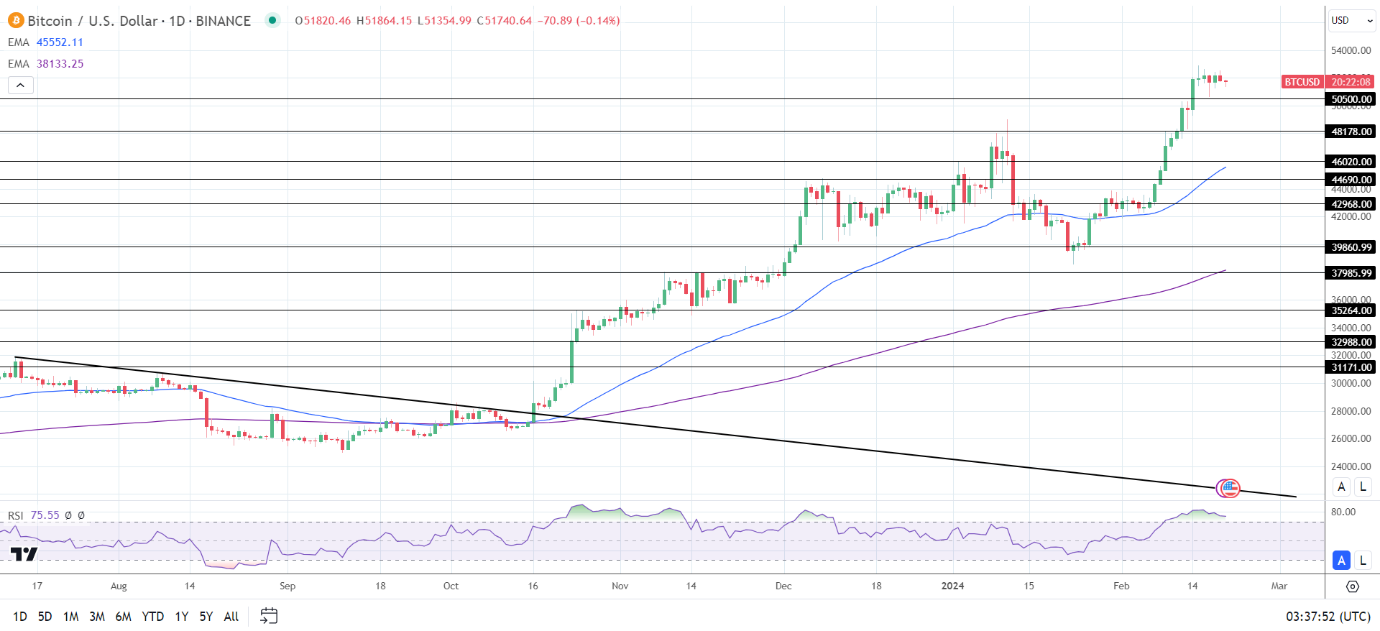
BTC sat well above the 50-day and 200-day EMAs, sending bullish price signals.
A BTC breakout from the February 15 high of $52,869 would give the bulls a run at the $55,000 handle.
Post-US holiday BTC-spot ETF market flows need consideration.
However, a break below the $51,500 handle would support a fall to the $50,500 support level.
The 14-Daily RSI reading, 75.55, shows BTC in overbought territory. Selling pressure could intensify at the $52,000 handle.
Ethereum Analysis
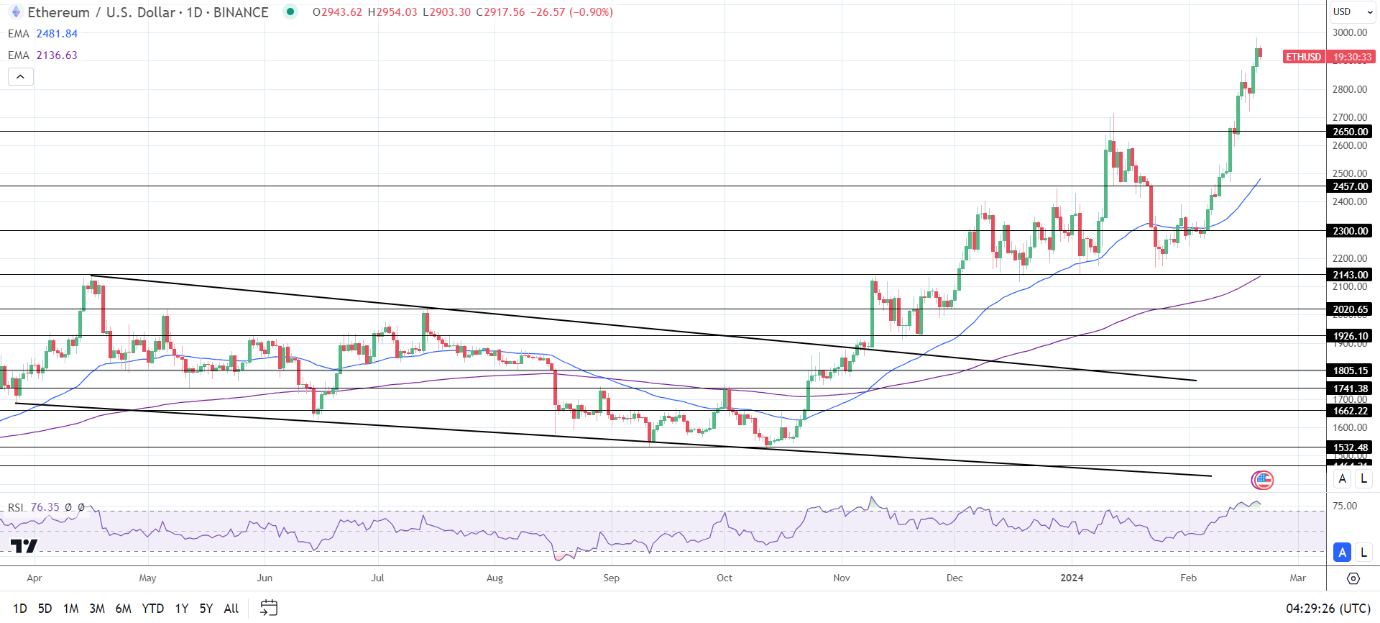
ETH hovered well above the 50-day and 200-day EMAs, confirming bullish price trends.
An ETH breakout from the Monday high of $2,984 would support a move through the $3,000 handle.
ETH-spot ETF-related activity warrants investor attention. More amendment filings could signal an increased likelihood the SEC will approve ETH-spot ETF applications in H1 2024.
However, an ETH drop below the $2,850 handle would give the bears a run at the $2,650 support level.
The 14-period Daily RSI at 76.35 shows ETH in overbought territory. Selling pressure could intensify at the Monday high of $2,984.
About the Author
Bob Masonauthor
With over 20 years of experience in the finance industry, Bob has been managing regional teams across Europe and Asia and focusing on analytics across both corporate and financial institutions. Currently he is covering developments relating to the financial markets, including currencies, commodities, alternative asset classes, and global equities.
Did you find this article useful?
Latest news and analysis


Advertisement