
Advertisement
Advertisement
Bitcoin Price Forecast: Struggles at Resistance, Uptrend Faces Key Test
By:
Bitcoin struggles at 78.6% Fibonacci retracement, facing resistance at 71,790. Uptrend remains intact but bearish divergence in RSI suggests correction may have more to go.
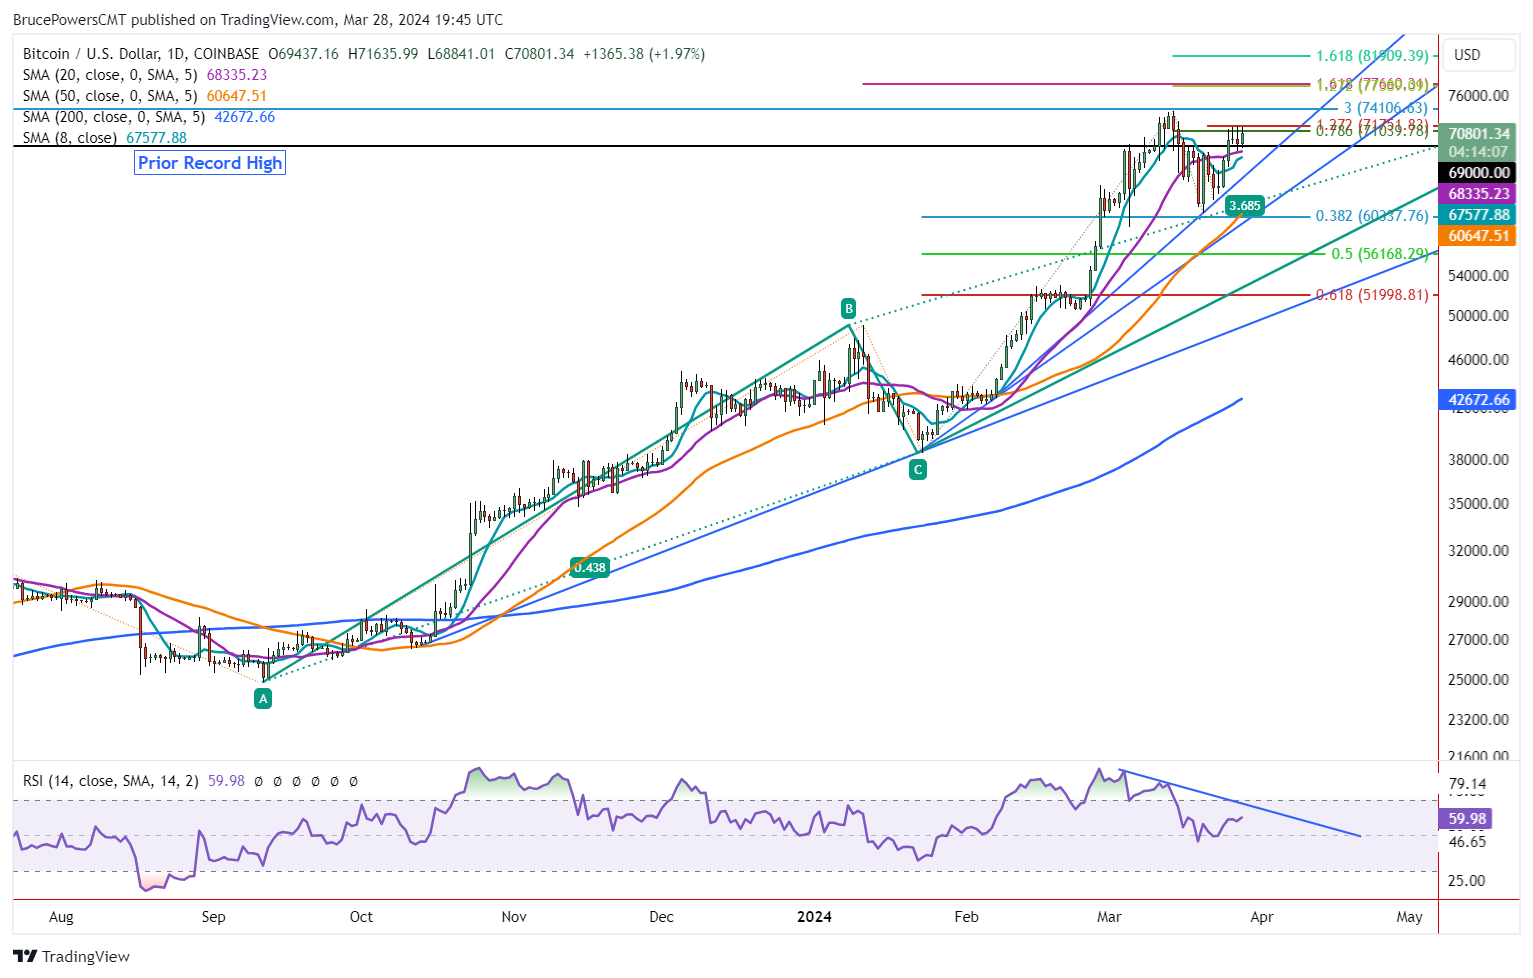
Bitcoin has been struck around resistance at the 78.6% Fibonacci retracement for the past four days as it attempts to break higher and further its advance. The high from the rally off the recent retracement low is 71,790. Trading has remained above the 20-Day MA for the past several days. Also, for the past four days Bitcoin has closed above the prior record high of 69,000 from November 2021.
Stuck at Near-Term Resistance
In addition to completing a 78.6% retracement, this week’s high also hit a target from a small rising ABCD pattern (not shown) with the CD leg extended by the 127.2% Fibonacci ratio. It starts from the recent retracement low of 60,771. Possibly, the 71,790-resistance area continues to stop the ascent and leads to a further correction.
Bitcoin is coming off a 35,335 point or 91.8% rally as seen in the most recent upswing prior to the recent retracement and arguably extended just on that metric. Also, the relative strength index (RSI) shows a bearish divergence. If correct, a drop below Wednesday’s low of 68,370 provides the first sign of weakness, which is further confirmed with a drop below this week’s low of 66,382.
Technical Picture Largely Bullish
Nonetheless, there remains a strong argument for a continuation higher prior to a deeper retracement. The uptrend remains well intact, and the recent retracement was relatively shallow having completed at the 38.2% Fibonacci level. In addition, Bitcoin stayed above the 8-Day MA during the retracement. Further, it got back above the 20-Day line this week after being below it for about six days. Finally, the weekly chart has a bullish continuation signal this week as last week’s high of 68.934 was exceeded. And it looks like the week may end in a strong position, above last week’s high.
Watching for Breakout Above This Week’s High
A decisive rally above this week’s high of 71,290 will trigger a bullish continuation of the uptrend. The chance to advance above the trend high will then improve. An initial new high target is around 77,660 that is identified with two Fibonacci levels. It includes the 161.8% Fibonacci extension of a large ABCD pattern as shown on the chart.
For a look at all of today’s economic events, check out our economic calendar.
About the Author
Bruce Powersauthor
Bruce boasts over 20 years in financial markets, holding senior roles such as Head of Trading Strategy at Relentless 13 Capital and Corporate Advisor at Chronos Futures. A CMT® charter holder and MBA in Finance, he's a renowned analyst and media figure, appearing on 150+ TV business shows.
Did you find this article useful?
Latest news and analysis


Advertisement