- Wall Street turns lower with investors turning cautious ahead of US CPI release.
- US inflation is expected to show mixed readings with levels well above the Fed’s 2% core target rate.
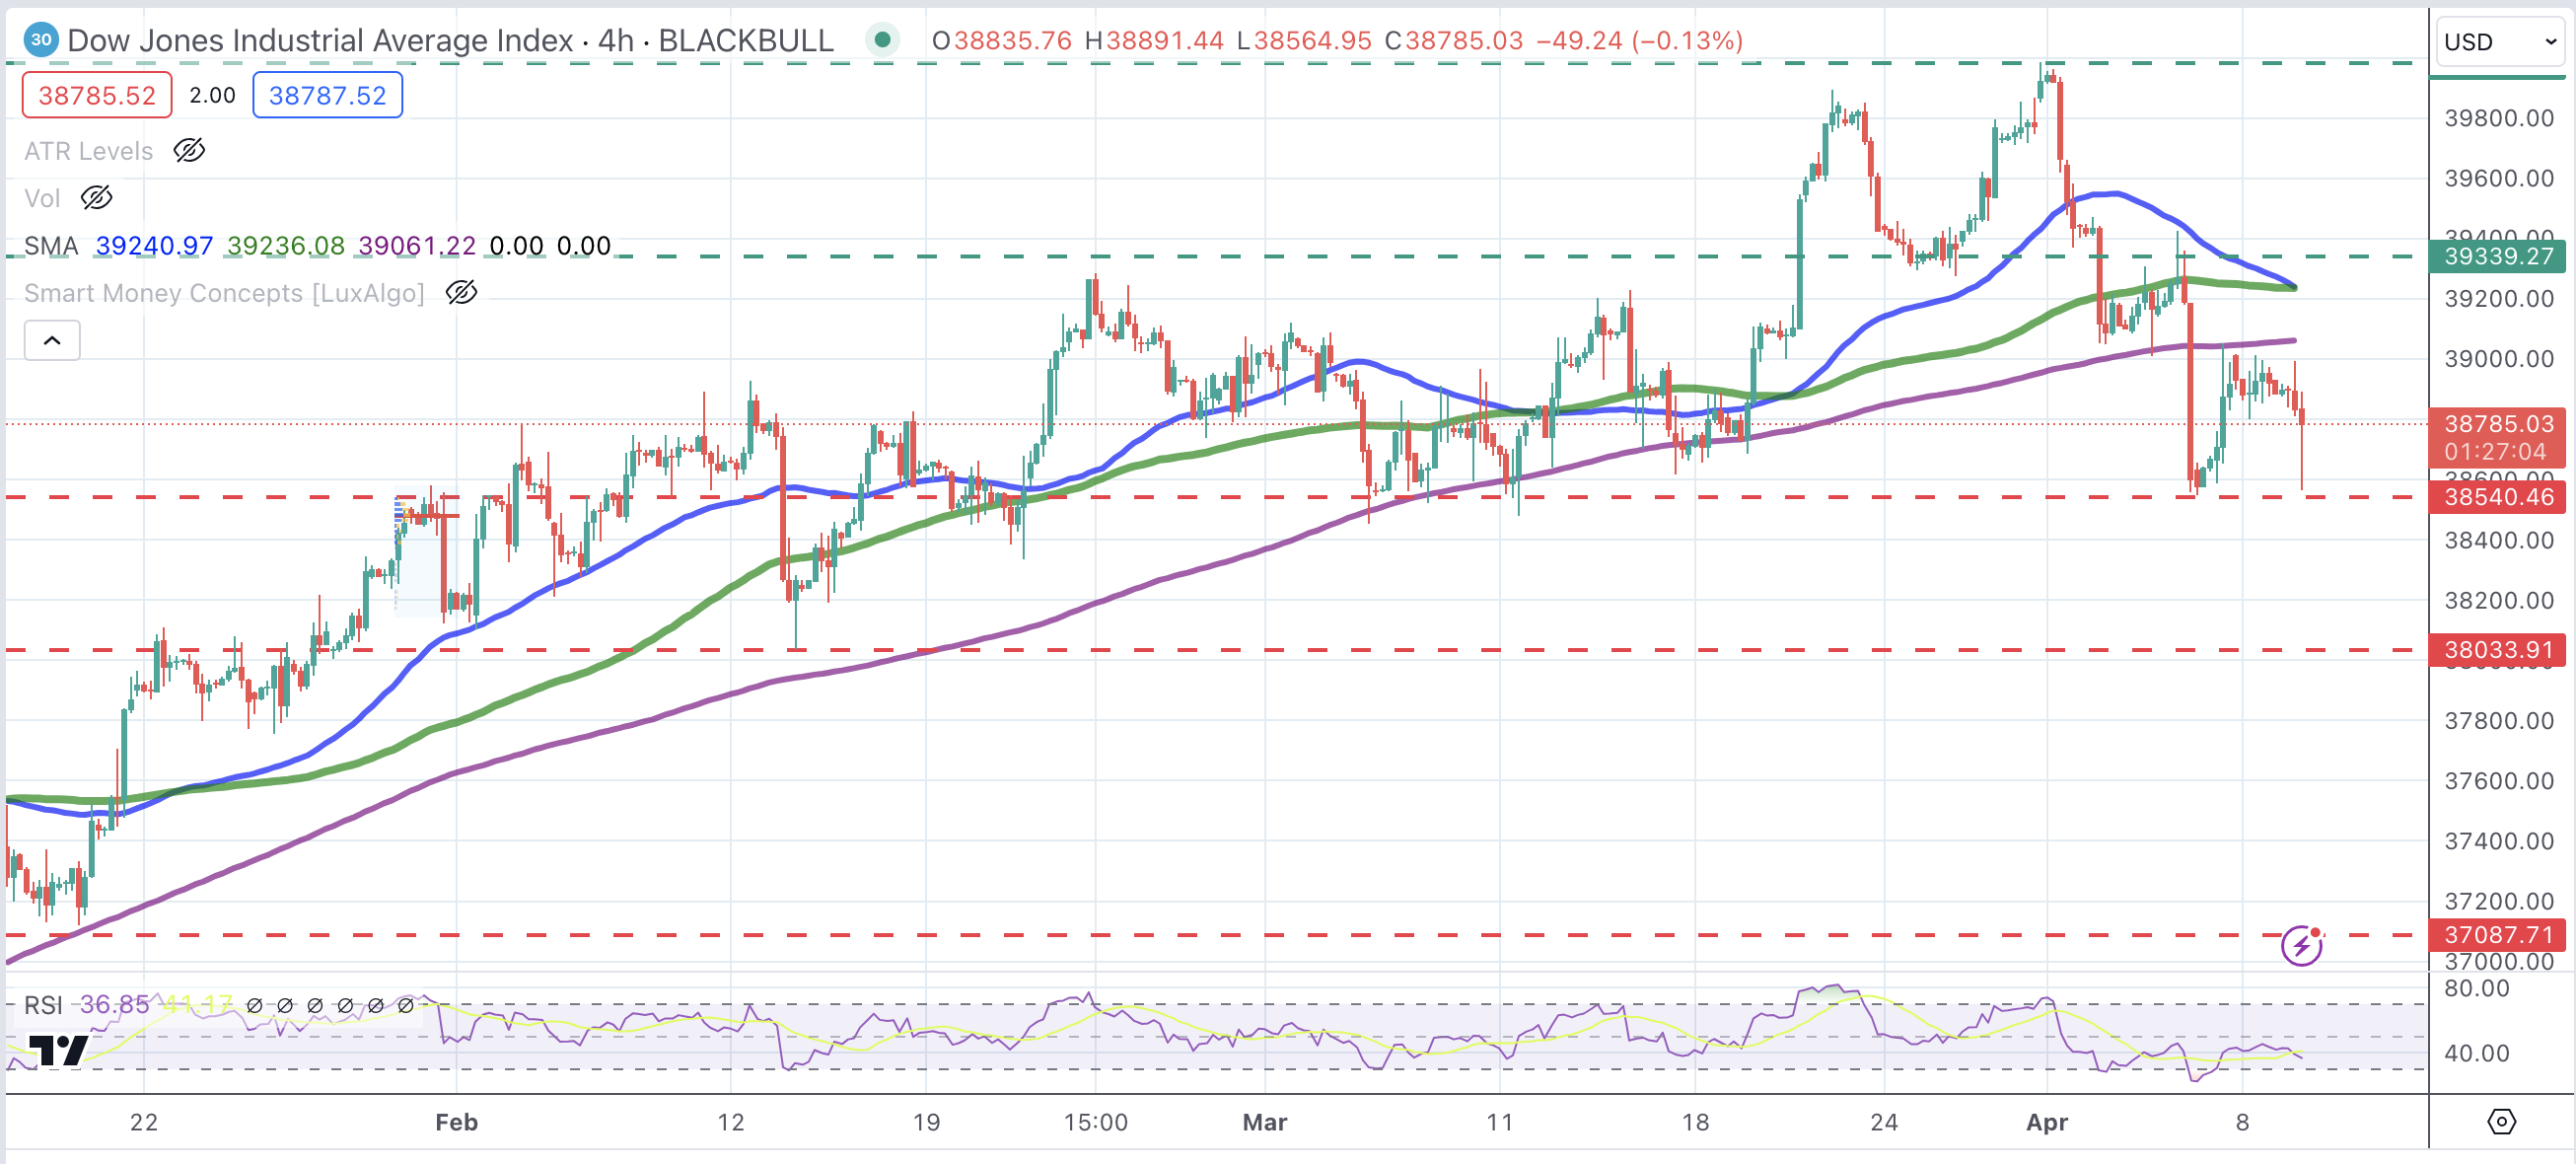
- The Dow Jones Index has found support at 38,540, although broader bias remains negative.
The Dow Jones Industrial Average (DJIA) has dropped into negative territory during Tuesday’s US morning session. The moderate risk appetite seen during the European trading session has waned in the US, with investors taking a cautious stance ahead of Tuesday’s US CPI release.
US Consumer Inflation is expected to have accelerated to 3.4% in March from the 3.2% annual rate in February. The core CPI, which scraps the impact of seasonal food and energy prices, is estimated to ease to 3.7% from a 3.8% annual reading for February. In any case, showing levels well above the Federal Reserve’s (Fed) 2% core inflation rate for price stability.
The cautious market mood has sent all the main Wall Street indices lower on Tuesday. The Dow Jones drops 0.43% to 38,726, followed by the S&P 500, which is 0.36% down to 5,181, and the NASDAQ Index, 0.28% lower to 16,208.
Dow Jones news
Among sectors, the Financials are getting the biggest blow with a 0.9% loss, followed by the Industrials, 0.6% lower, and Energy, dropping 0.5%. Real Estate is 0.6%, while Utilities and Consumer Staples and Consumer Discretionary are moving about 0.1% higher each.
Travelers Companies (TRV) is the worst-performing stock in the Dow Jones, losing 2.3% to $225.28, followed by American Express (AXP) which is down 1.8% to $219.83. The biggest winners are Cisco Systems (CSCO), up 2.79%, to $49.59, and 3M (MMM), advancing 1.23% to $93.06.
Dow Jones technical outlook
The technical picture shows the Dow Jones index picking up after having tested the support area at 38,540. The broader trend, however, remains bearish with the pair correcting lower from March highs near 40,000.
A further decline below 38,540 would expose February’s low at 38,035. On the upside, the pair should breach the 39,340 resistance area to break the negative price structure and open the path toward the all-time high at 39,985.
Dow Jones Index 4-Hour Chart
Dow Jones FAQs
The Dow Jones Industrial Average, one of the oldest stock market indices in the world, is compiled of the 30 most traded stocks in the US. The index is price-weighted rather than weighted by capitalization. It is calculated by summing the prices of the constituent stocks and dividing them by a factor, currently 0.152. The index was founded by Charles Dow, who also founded the Wall Street Journal. In later years it has been criticized for not being broadly representative enough because it only tracks 30 conglomerates, unlike broader indices such as the S&P 500.
Many different factors drive the Dow Jones Industrial Average (DJIA). The aggregate performance of the component companies revealed in quarterly company earnings reports is the main one. US and global macroeconomic data also contributes as it impacts on investor sentiment. The level of interest rates, set by the Federal Reserve (Fed), also influences the DJIA as it affects the cost of credit, on which many corporations are heavily reliant. Therefore, inflation can be a major driver as well as other metrics which impact the Fed decisions.
Dow Theory is a method for identifying the primary trend of the stock market developed by Charles Dow. A key step is to compare the direction of the Dow Jones Industrial Average (DJIA) and the Dow Jones Transportation Average (DJTA) and only follow trends where both are moving in the same direction. Volume is a confirmatory criteria. The theory uses elements of peak and trough analysis. Dow’s theory posits three trend phases: accumulation, when smart money starts buying or selling; public participation, when the wider public joins in; and distribution, when the smart money exits.
There are a number of ways to trade the DJIA. One is to use ETFs which allow investors to trade the DJIA as a single security, rather than having to buy shares in all 30 constituent companies. A leading example is the SPDR Dow Jones Industrial Average ETF (DIA). DJIA futures contracts enable traders to speculate on the future value of the index and Options provide the right, but not the obligation, to buy or sell the index at a predetermined price in the future. Mutual funds enable investors to buy a share of a diversified portfolio of DJIA stocks thus providing exposure to the overall index.
Information on these pages contains forward-looking statements that involve risks and uncertainties. Markets and instruments profiled on this page are for informational purposes only and should not in any way come across as a recommendation to buy or sell in these assets. You should do your own thorough research before making any investment decisions. FXStreet does not in any way guarantee that this information is free from mistakes, errors, or material misstatements. It also does not guarantee that this information is of a timely nature. Investing in Open Markets involves a great deal of risk, including the loss of all or a portion of your investment, as well as emotional distress. All risks, losses and costs associated with investing, including total loss of principal, are your responsibility. The views and opinions expressed in this article are those of the authors and do not necessarily reflect the official policy or position of FXStreet nor its advertisers. The author will not be held responsible for information that is found at the end of links posted on this page.
If not otherwise explicitly mentioned in the body of the article, at the time of writing, the author has no position in any stock mentioned in this article and no business relationship with any company mentioned. The author has not received compensation for writing this article, other than from FXStreet.
FXStreet and the author do not provide personalized recommendations. The author makes no representations as to the accuracy, completeness, or suitability of this information. FXStreet and the author will not be liable for any errors, omissions or any losses, injuries or damages arising from this information and its display or use. Errors and omissions excepted.
The author and FXStreet are not registered investment advisors and nothing in this article is intended to be investment advice.
Recommended content
Editors’ Picks
AUD/USD retargets the 0.6600 barrier and above

AUD/USD extended its positive streak for the sixth session in a row at the beginning of the week, managing to retest the transitory 100-day SMA near 0.6580 on the back of the solid performance of the commodity complex.
EUR/USD keeps the bullish bias above 1.0700

EUR/USD rapidly set aside Friday’s decline and regained strong upside traction in response to the marked retracement in the Greenback following the still-unconfirmed FX intervention by the Japanese MoF.
Gold advances for a third consecutive day

Gold fluctuates in a relatively tight channel above $2,330 on Monday. The benchmark 10-year US Treasury bond yield corrects lower and helps XAU/USD limit its losses ahead of this week's key Fed policy meeting.
Bitcoin price dips to $62K range despite growing international BTC validation via spot ETFs

Bitcoin (BTC) price closed down for four weeks in a row, based on the weekly chart, and could be on track for another red candle this week. The last time it did this was in the middle of the bear market when it fell by 42% within a span of nine weeks.
Japan intervention: Will it work?

Dear Japan Intervenes in the Yen for the first time since November 2022 Will it work? Have we seen a top in USDJPY? Let's go through the charts.