
 Yahoo Finance
 DBS Group Holdings Ltd's Dividend Analysis
Understanding the Dividend Future of DBS Group Holdings Ltd
DBS Group Holdings Ltd (DBSDY) recently announced a dividend of $1.61 per share, payable on 2024-04-29, with the ex-dividend date set for 2024-04-05. As investors look forward to this upcoming payment, the spotlight also shines on the company's dividend history, yield, and growth rates. Using the data from GuruFocus, let's look into DBS Group Holdings Ltd's dividend performance and assess its sustainability.
What Does DBS Group Holdings Ltd Do?
This Powerful Chart Made Peter Lynch 29% A Year For 13 Years
How to calculate the intrinsic value of a stock?
DBS Group is a Singapore-based banking group offering a full range of services to consumers, small to midsize enterprises, and corporations and institutions. Its main presence is in Singapore and Greater China. The recent acquisition of Lakshmi Vilas Bank has strengthened DBS's operations in India, and the acquisition of Citibank's Taiwan operation should bring additional growth in Greater China. DBS's wealth management division is one of the largest in Asia, with assets under management of SGD 320 billion as of June 2023.
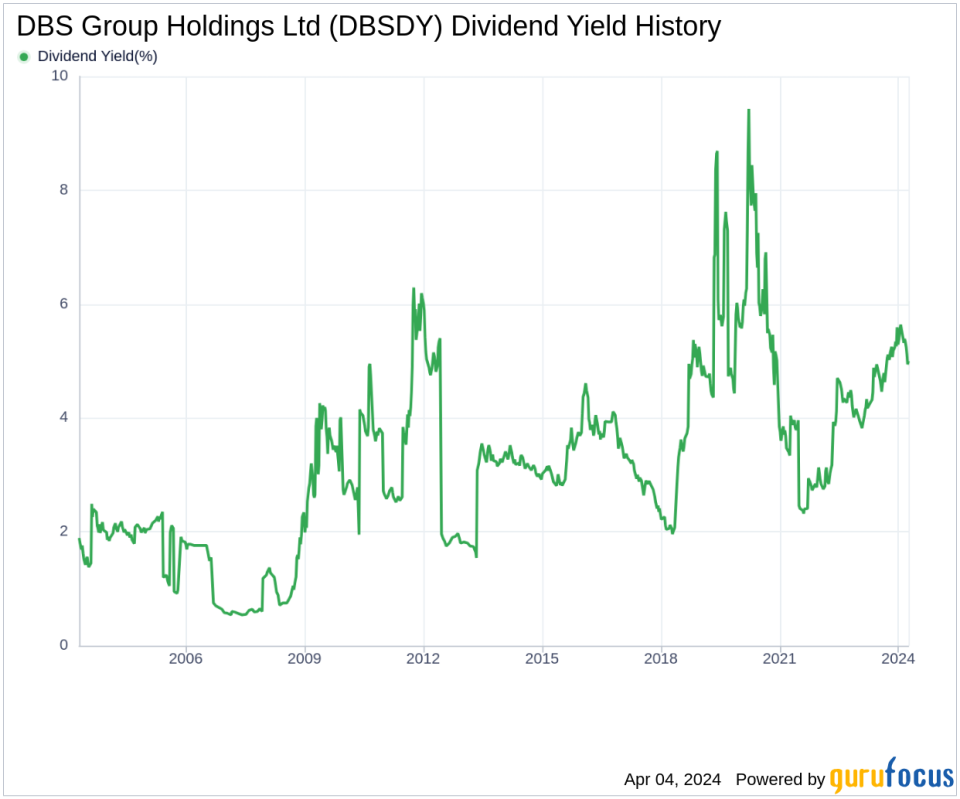
A Glimpse at DBS Group Holdings Ltd's Dividend History
DBS Group Holdings Ltd has maintained a consistent dividend payment record since 2003. Dividends are currently distributed on a quarterly basis. Below is a chart showing annual Dividends Per Share for tracking historical trends.
Breaking Down DBS Group Holdings Ltd's Dividend Yield and Growth
As of today, DBS Group Holdings Ltd currently has a 12-month trailing dividend yield of 4.98% and a 12-month forward dividend yield of 5.30%. This suggests an expectation of increased dividend payments over the next 12 months.
Over the past three years, DBS Group Holdings Ltd's annual dividend growth rate was 20.80%. Extended to a five-year horizon, this rate decreased to 5.60% per year. And over the past decade, DBS Group Holdings Ltd's annual dividends per share growth rate stands at an impressive 12.50%.
Based on DBS Group Holdings Ltd's dividend yield and five-year growth rate, the 5-year yield on cost of DBS Group Holdings Ltd stock as of today is approximately 6.54%.
The Sustainability Question: Payout Ratio and Profitability
To assess the sustainability of the dividend, one needs to evaluate the company's payout ratio. The dividend payout ratio provides insights into the portion of earnings the company distributes as dividends. A lower ratio suggests that the company retains a significant part of its earnings, thereby ensuring the availability of funds for future growth and unexpected downturns. As of 2023-12-31, DBS Group Holdings Ltd's dividend payout ratio is 0.26.
DBS Group Holdings Ltd's profitability rank, offers an understanding of the company's earnings prowess relative to its peers. GuruFocus ranks DBS Group Holdings Ltd's profitability 6 out of 10 as of 2023-12-31, suggesting fair profitability. The company has reported positive net income for each of year over the past decade, further solidifying its high profitability.
Growth Metrics: The Future Outlook
To ensure the sustainability of dividends, a company must have robust growth metrics. DBS Group Holdings Ltd's growth rank of 6 out of 10 suggests that the company has a fair growth outlook.
Revenue is the lifeblood of any company, and DBS Group Holdings Ltd's revenue per share, combined with the 3-year revenue growth rate, indicates a strong revenue model. DBS Group Holdings Ltd's revenue has increased by approximately 11.00% per year on average, a rate that outperforms approximately 67.57% of global competitors.
The company's 3-year EPS growth rate showcases its capability to grow its earnings, a critical component for sustaining dividends in the long run. During the past three years, DBS Group Holdings Ltd's earnings increased by approximately 28.90% per year on average, a rate that outperforms approximately 77.84% of global competitors.
Lastly, the company's 5-year EBITDA growth rate of 12.50%, which outperforms approximately 67.49% of global competitors.
Next Steps
In conclusion, DBS Group Holdings Ltd's forthcoming dividend, along with its historical dividend growth, presents an attractive proposition for income-focused investors. The company's moderate payout ratio and solid profitability indicate that dividends are well-covered by earnings. Furthermore, DBS Group Holdings Ltd's reliable growth metrics provide confidence in the potential for future dividend increases. Investors seeking to capitalize on high-dividend yield opportunities may consider exploring the High Dividend Yield Screener available for GuruFocus Premium users.
This article, generated by GuruFocus, is designed to provide general insights and is not tailored financial advice. Our commentary is rooted in historical data and analyst projections, utilizing an impartial methodology, and is not intended to serve as specific investment guidance. It does not formulate a recommendation to purchase or divest any stock and does not consider individual investment objectives or financial circumstances. Our objective is to deliver long-term, fundamental data-driven analysis. Be aware that our analysis might not incorporate the most recent, price-sensitive company announcements or qualitative information. GuruFocus holds no position in the stocks mentioned herein.
This article first appeared on GuruFocus.
