Most Read: Market Sentiment Analysis and Outlook - Gold, WTI Crude Oil, S&P 500
Want to know where EUR/USD is headed over the coming months? Discover the answers in our quarterly forecast. Request your complimentary guide today!

EUR/USD FORECAST – TECHNICAL ANALYSIS
EUR/USD began the week on the back foot, slipping below support at 1.0635 and hitting its lowest level since early November of last year, with losses now exceeding 2.4% from April’s swing high. Confirmation of Monday's breakdown in the coming days may accelerate selling momentum, potentially paving the way for a descent toward the 2023 lows at 1.0450.
On the other hand, if EUR/USD orchestrates a comeback and reclaims the 1.0635 threshold, resistance can be spotted near the 1.0700 psychological mark. On further strength, the focus will be on 1.0725. Bears must vigorously uphold this technical ceiling; any failure to do so might ignite a rally towards the 50-day and 200-day simple moving averages, hovering near 1.0820.
EUR/USD PRICE ACTION CHART
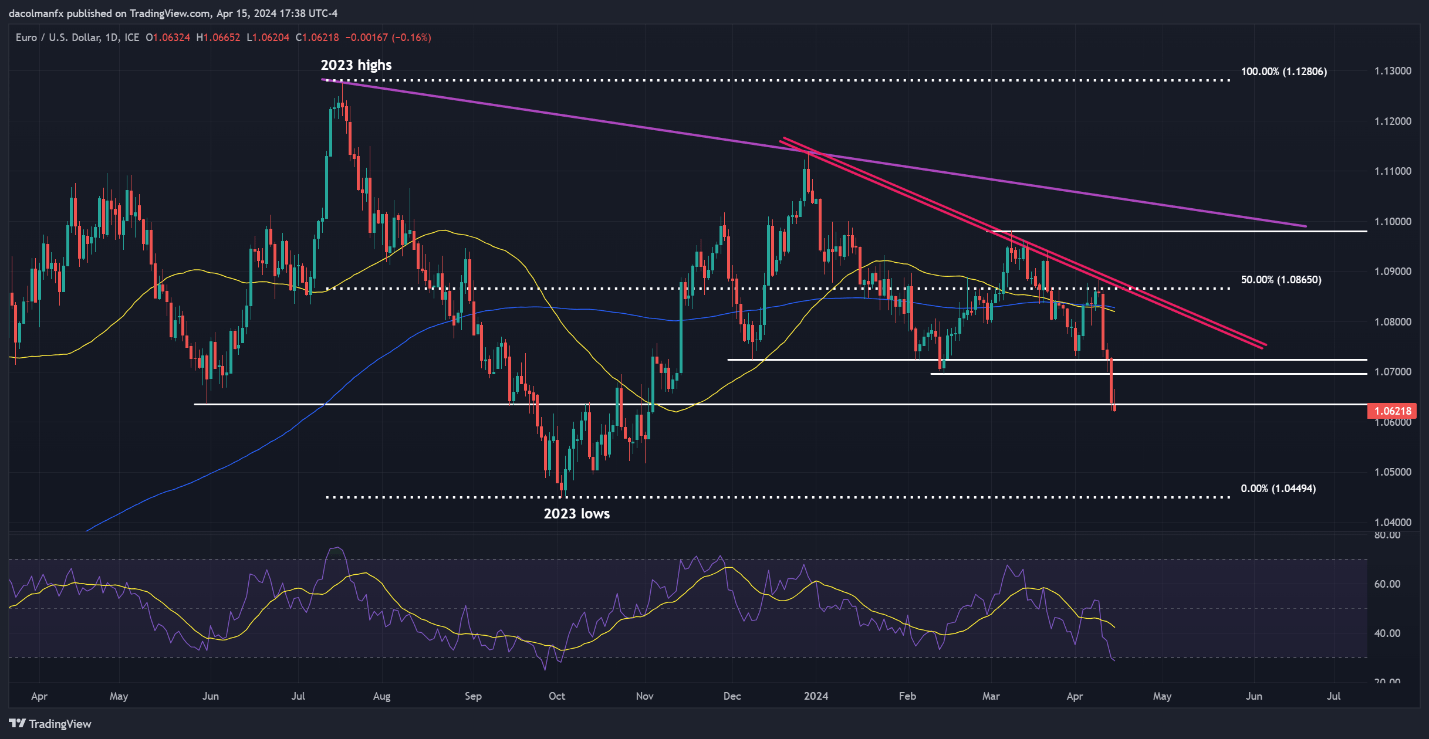
EUR/USD Chart Created Using TradingView
Interested in learning how retail positioning can offer clues about USD/JPY’s directional bias? Our sentiment guide contains valuable insights into market psychology as a trend indicator. Download it now!
| Change in | Longs | Shorts | OI |
| Daily | 30% | -19% | -12% |
| Weekly | 14% | -19% | -14% |
USD/JPY FORECAST – TECHNICAL ANALYSIS
USD/JPY soared on Monday, climbing past the 152.00 handle and hitting its highest level since June 1990, buoyed by rising U.S. Treasury yields. With bulls in control of the market, we could soon see a move towards channel resistance at 155.80; but gains could be temporary, as the Japanese government could step in to support the yen on a decisive break above the 155.00 threshold.
Conversely, if bulls start taking profits on their long positions and USD/JPY pivots to the downside, support materializes at 153.20 and 152.00 thereafter. Prices could stabilize around this technical floor during a pullback, but in the event of a breakdown, bears could set their sights on 150.80, followed by 150.50, the 50-day simple moving average.
USD/JPY PRICE ACTION CHART
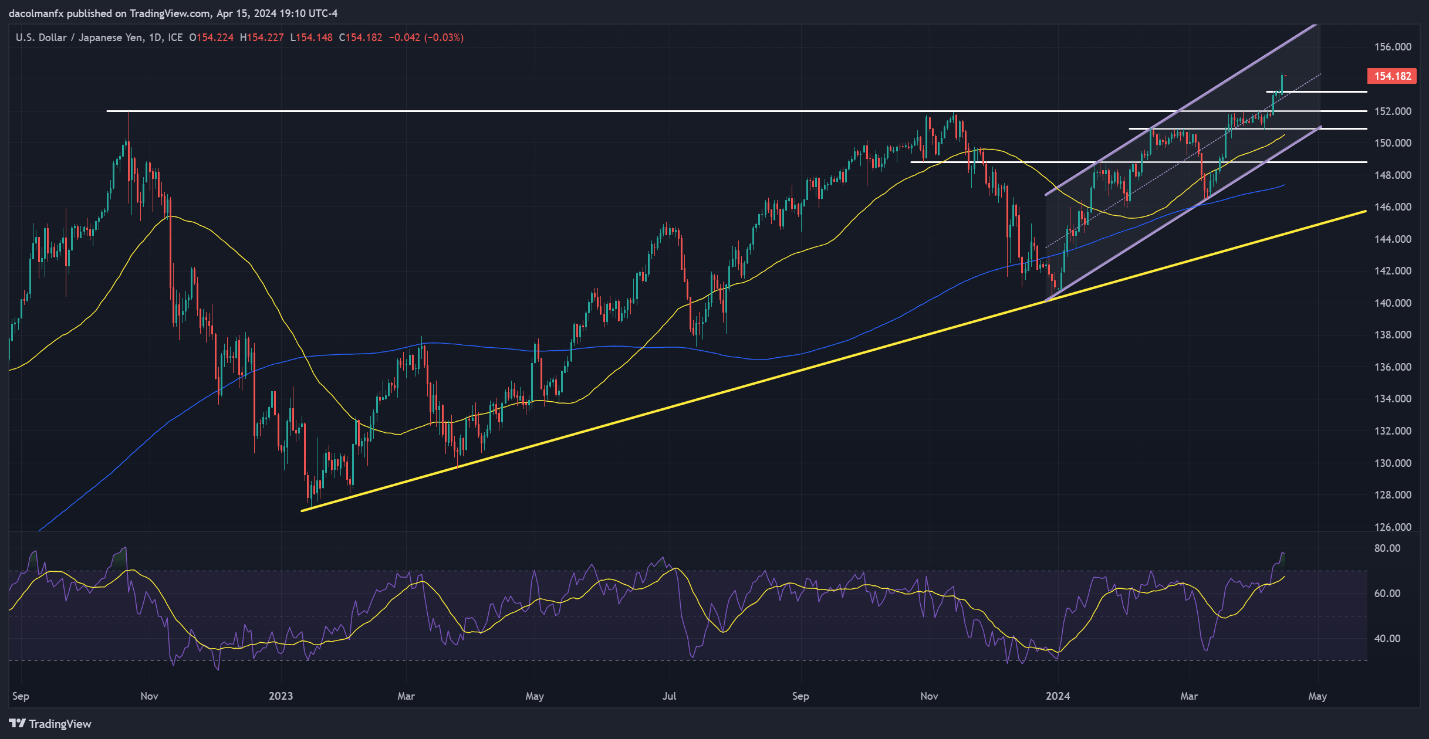
USD/JPY Chart Created Using TradingView
Curious about what lies ahead for the British pound? Find key insights in our quarterly trading forecast. Claim your free copy now!

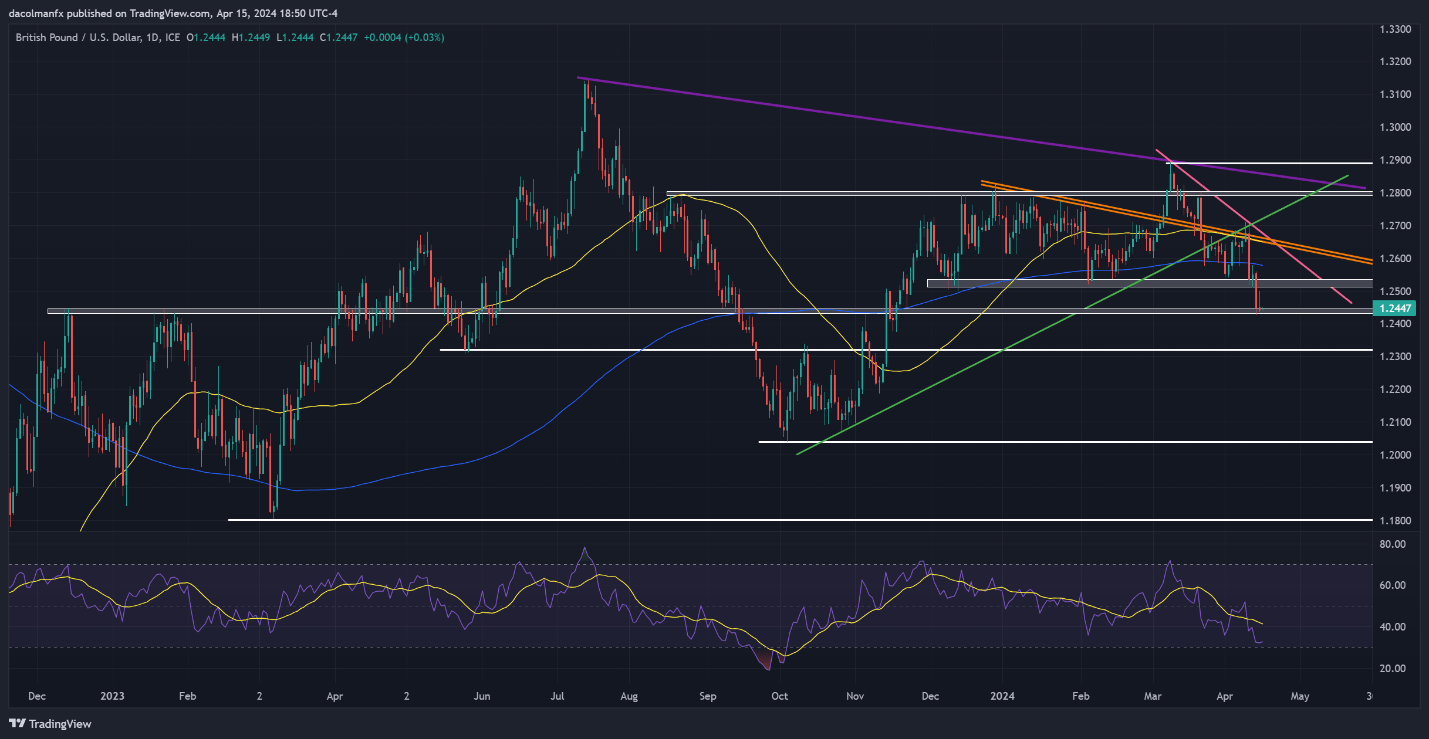
GBP/USD FORECAST – TECHNICAL ANALYSIS
GBP/USD experienced a slight decline on Monday but maintained its position above support at 1.2435. To bolster sentiment towards the pound, it's essential for this technical floor to remain intact; failure to prevent a breakdown could result in a pullback towards 1.2325. On further weakness, bears may feel emboldened to initiate an attack on the October 2023 lows around 1.2040.
On the flip side, if sentiment shifts back in favor of buyers and cable manages to mount a bullish reversal, primary resistance emerges at 1.2525. Above this area, attention will be on the 200-day simple moving average at 1.2580, followed by 1.2650, where the 50-day simple moving average intersects with two important short-term trendlines.
GBP/USD PRICE ACTION CHART