
Most Read: Gold Price Outlook: Bulls in Control but Bearish Risks Grow on Stretched Markets
Trading often tempts us to follow the masses – buying when excitement peaks and selling amidst widespread fear. However, seasoned traders understand the possibilities that lie within contrarian strategies. Indicators like IG client sentiment provide a unique lens into the market's overall mindset, potentially highlighting instances where extreme optimism or pessimism might signal an impending shift in direction.
Naturally, contrarian signals aren't a crystal ball. Their true strength lies in how they're used alongside a robust trading plan. By carefully integrating contrarian insights with technical and fundamental analysis, traders develop a more nuanced picture of the forces driving the market – aspects that the crowd could easily miss. Let's delve into this idea by analyzing IG client sentiment and its potential impact on gold, WTI crude oil and the S&P 500.
For an extensive analysis of gold’s medium-term prospects, download our complimentary Q2 trading forecast now!

Gold Price Forecast – Market Sentiment
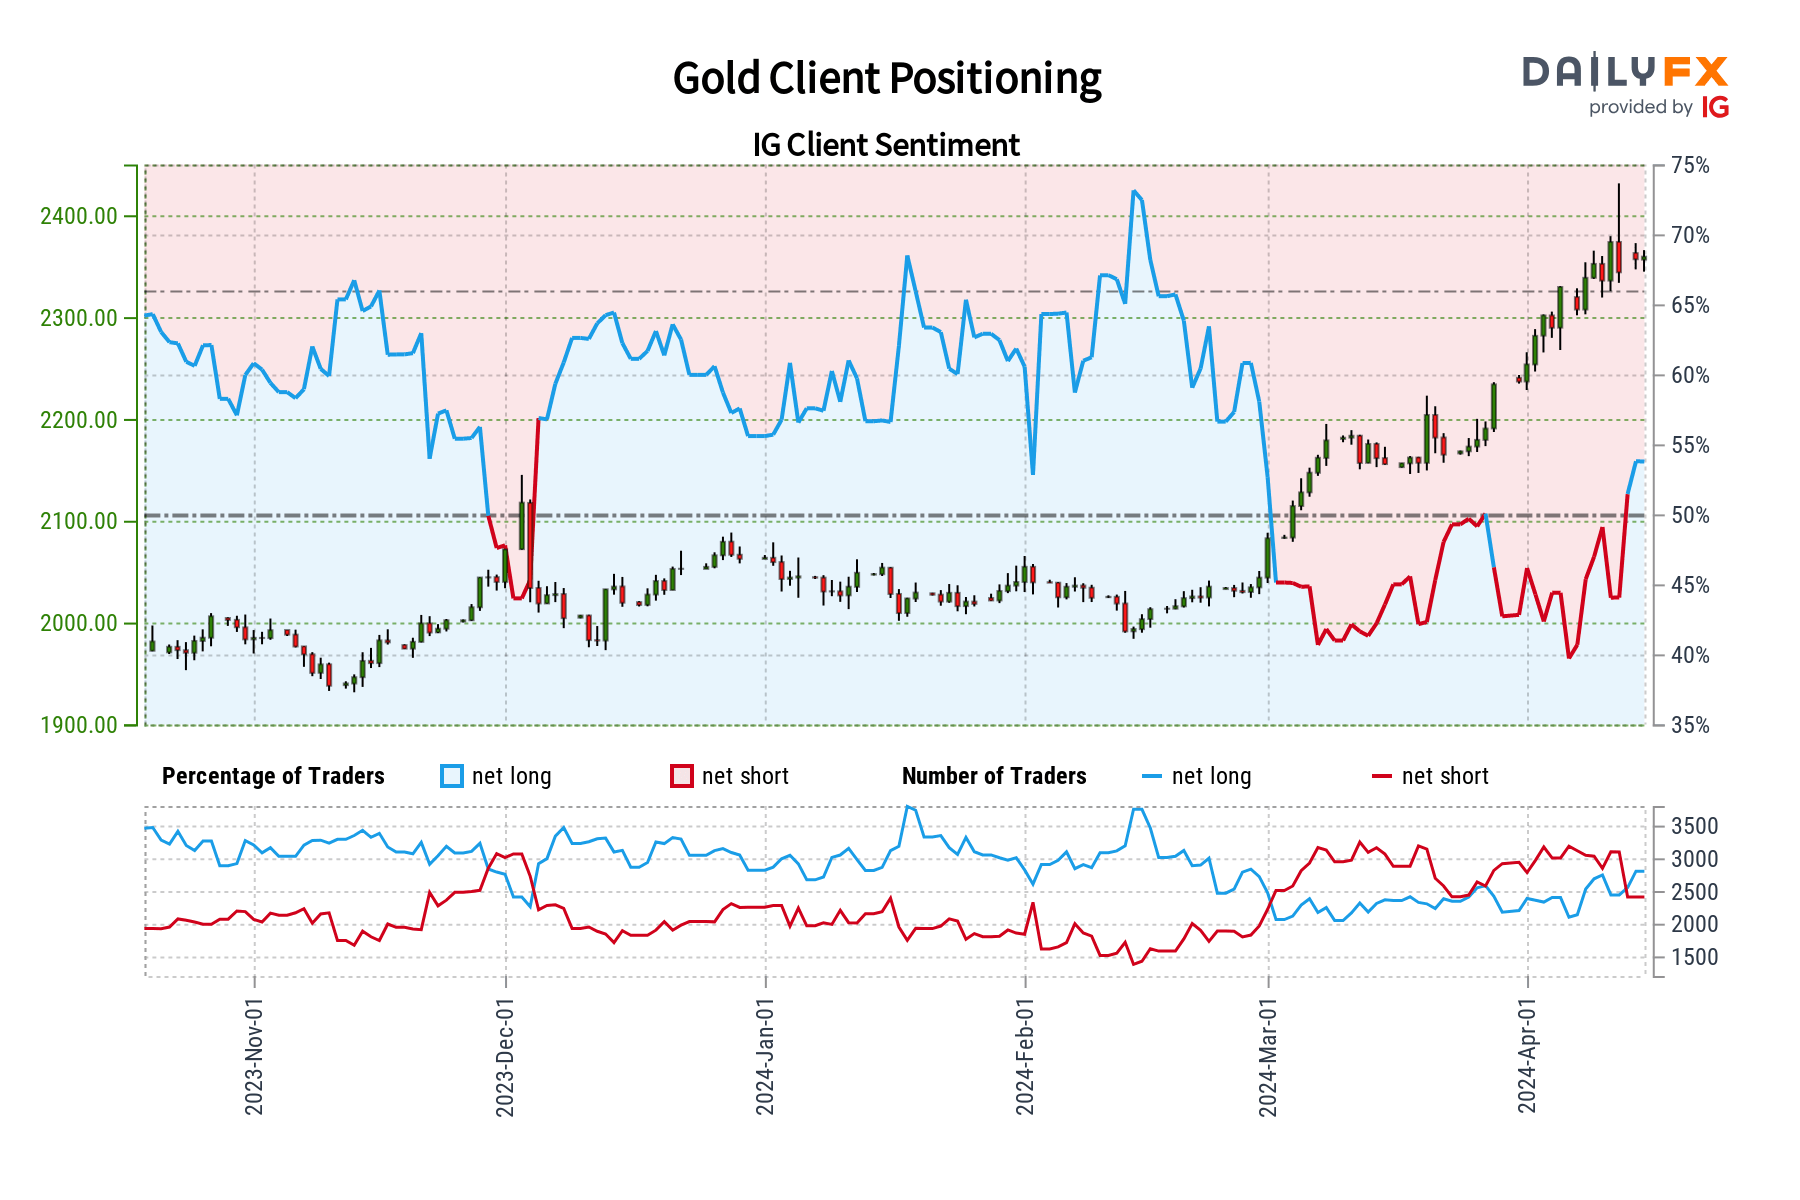
IG data reveals a bullish bias among traders towards gold, with 55.00% currently holding net-long positions. This translates to a long-to-short ratio of 1.22 to 1. Furthermore, this bullish sentiment has intensified compared to yesterday (up 7.50%) and last week (up 26.32%).
Our trading strategy often leans towards a contrarian perspective. The prevailing bullishness on gold suggests a potential pullback in prices. The ongoing increase in buying positions further reinforces this bearish contrarian outlook.
Important Reminder: While contrarian signals provide valuable insights, they are best used to complement a well-rounded trading strategy. Always consider technical and fundamental analyses for a more comprehensive approach to trading gold.
Wondering how retail positioning can shape crude oil’s trajectory in the near term? Our sentiment guide provides the answers you are looking for and outlines key strategies—don't miss out, get the guide now!
| Change in | Longs | Shorts | OI |
| Daily | 10% | 0% | 6% |
| Weekly | -9% | 10% | -4% |
Crude Oil Price Forecast – Market Sentiment
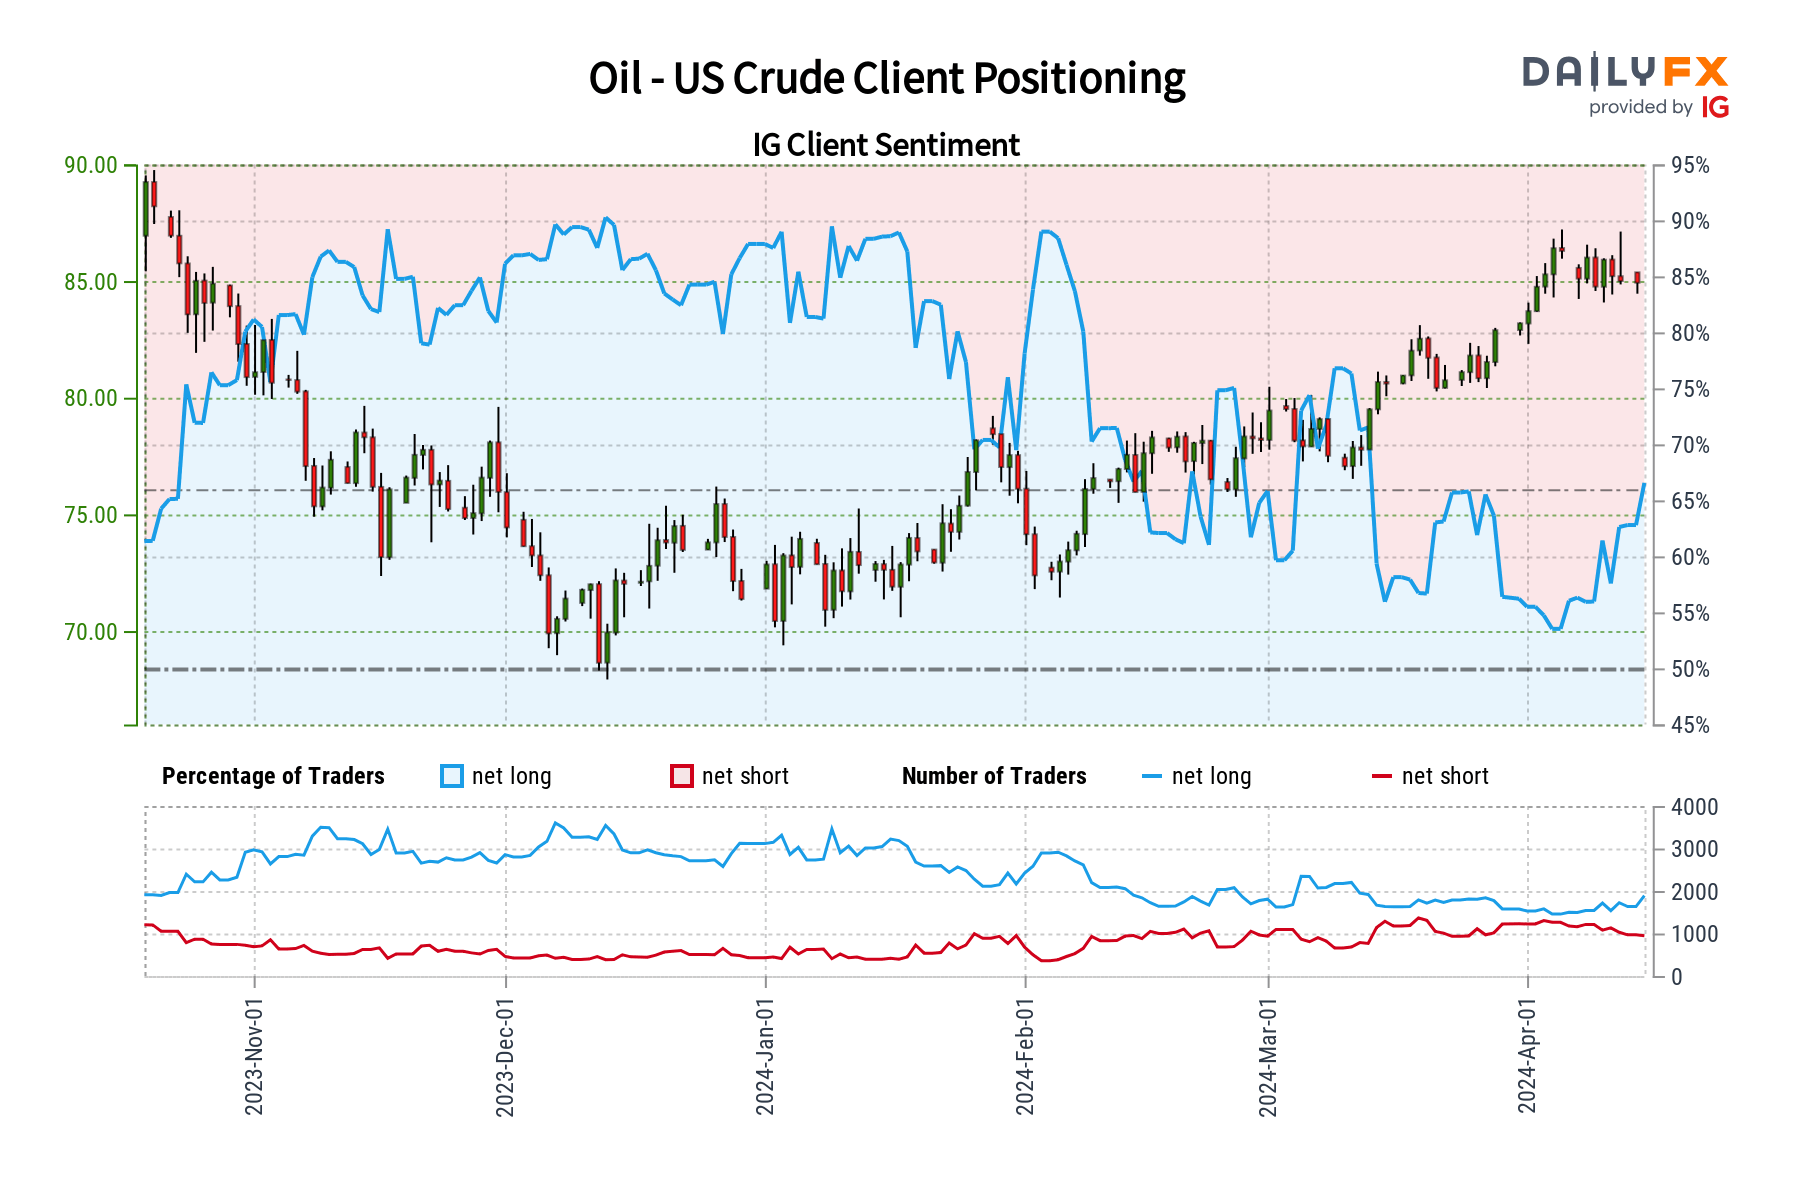
IG data shows that 69.46% of clients are holding long positions on crude oil, with the ratio of bullish to bearish position clocking in at 2.27 to 1. The number of traders with net long positions is up 8.26% from the previous session and 29.27% from last week's levels. Meanwhile, the tally of sellers is 1.28% lower than the day before and 20.82% beneath prevailing levels seven days ago.
We often employ a contrarian perspective in our trading. This widespread bullishness on oil suggests a potential downward price correction may be in store. The continued increase in net-long positions further strengthens this bearish contrarian outlook.
Important reminder: While contrarian signals offer valuable insights, they should be integrated into a broader analytical framework. Consider technical and fundamental factors alongside sentiment data for a more informed trading decision.
If you're looking for an in-depth analysis of U.S. equity indices, our second-quarter stock market trading forecast is packed with great fundamental and technical insights. Request it now!

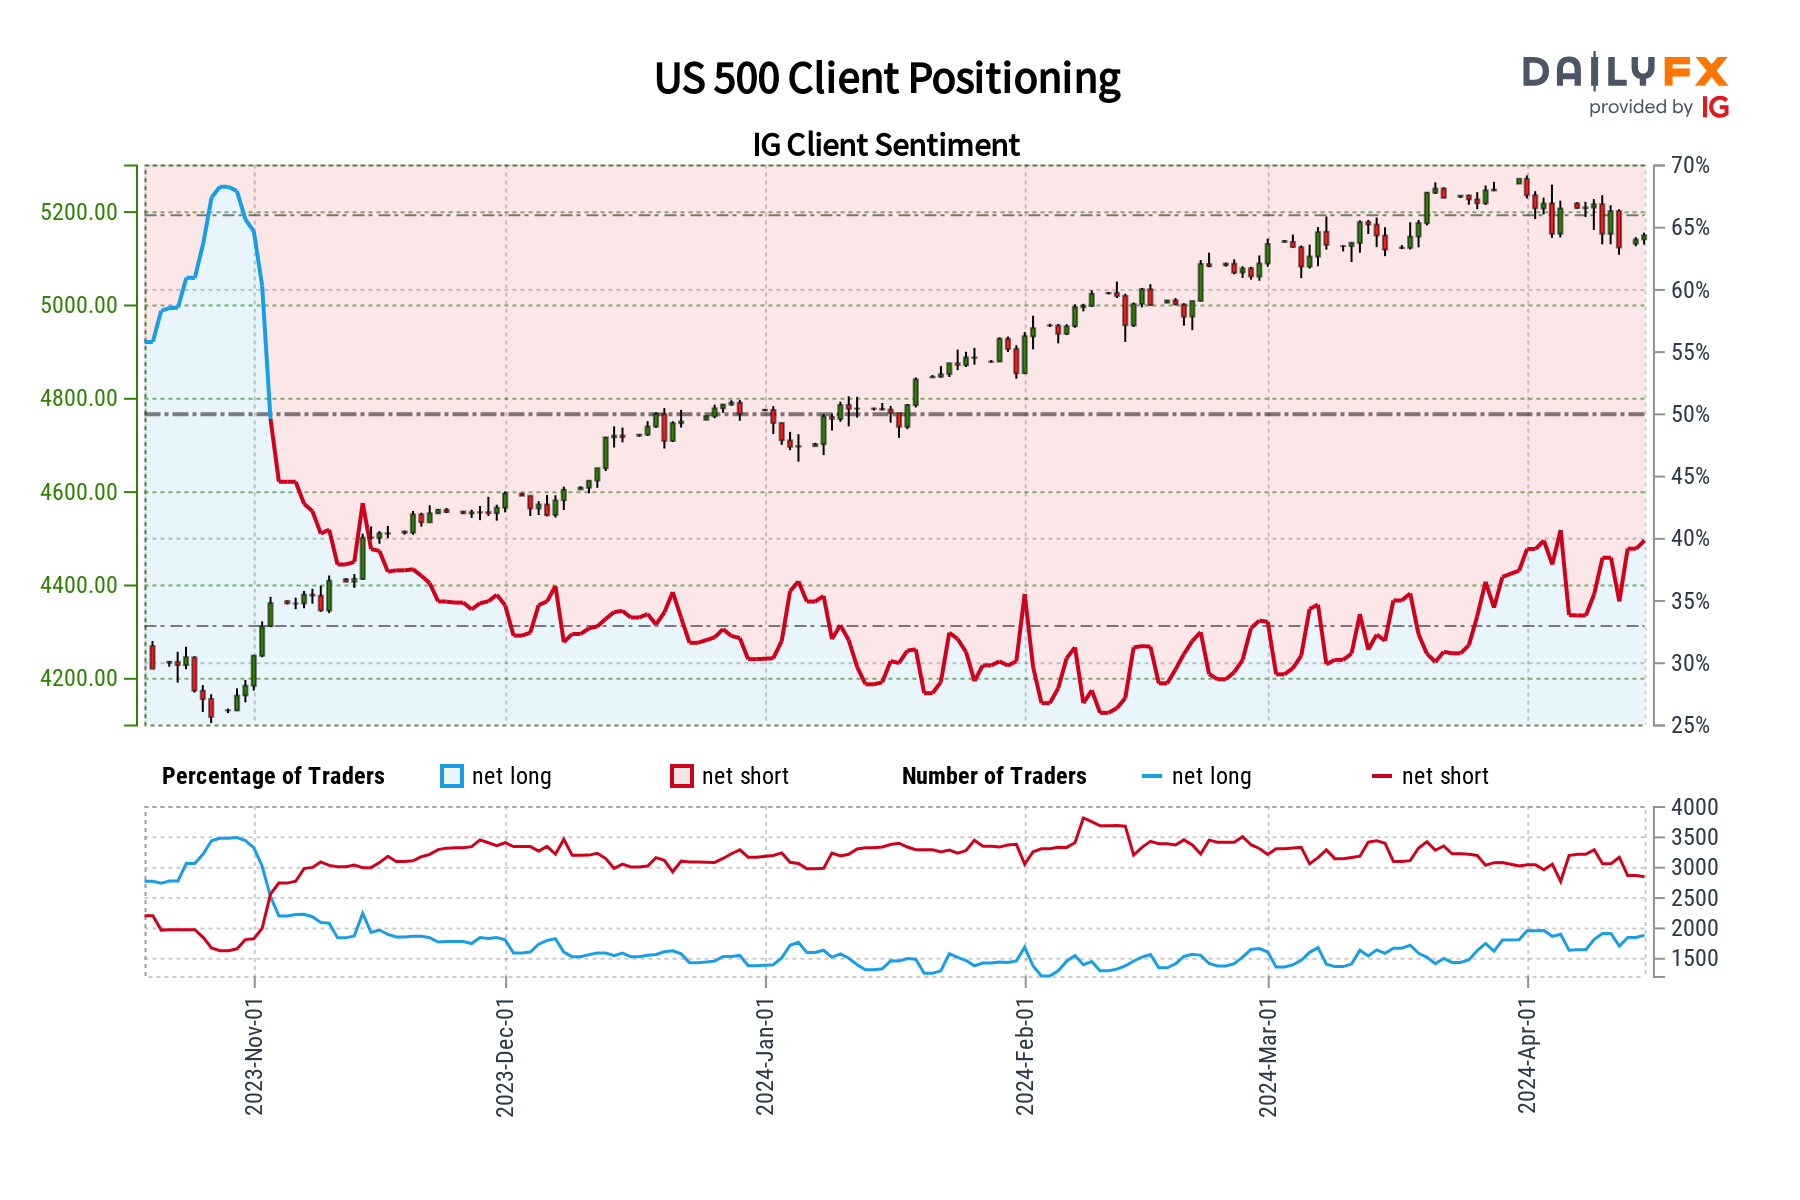
S&P 500 Forecast – Market Sentiment
IG data reveals a predominantly bearish stance on the S&P 500 by the retail crowd, with 61.45% of clients holding net-short positions. This results in a short-to-long ratio of 1.59 to 1. Interestingly, while this bearishness has increased slightly since yesterday (4.65%), it has actually decreased compared to last week (7.08%).
We often lean towards a contrarian perspective on market sentiment. The current pessimism on the S&P 500 suggests there may be room for additional upside. However, the conflicting signals in recent positioning changes (more bearish yesterday, less so compared to last week) cast some doubt on this outlook, leading to a more neutral contrarian stance.
Important Reminder: Remember, contrarian signals offer a unique perspective but should always be considered alongside technical and fundamental analysis for a comprehensive trading approach.